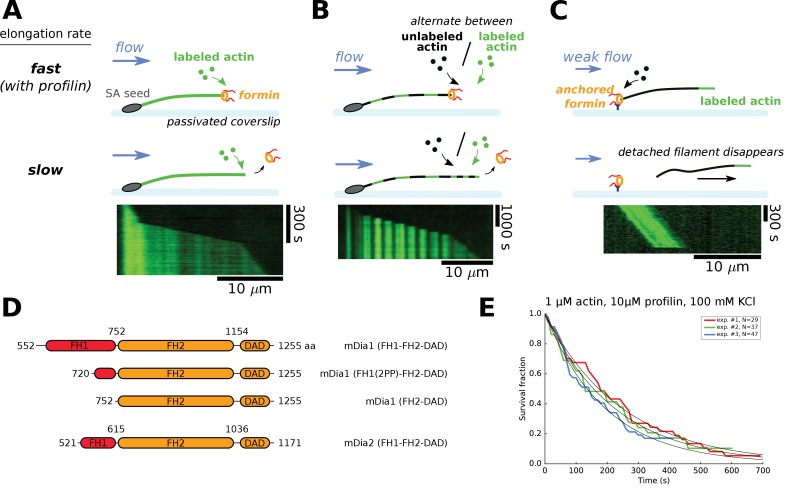
Figure 1. Single-filament microfluidics experimental configurations to measure formin processivity.
(A–C) Different experimental configurations using microfluidics for the study of formin processivity, showing sketches of the side view (top) and typical kymographs of individual filaments (bottom). (A) Alexa 488 labeled actin filaments are elongated from surface-anchored spectrin-actin seeds. Transient exposure to a formin solution puts formins on filament barbed ends, which elongate faster (here in the presence of 1 µM 15% Alexa 488 labeled actin +5 µM profilin, at 100 mM KCl). Upon formin dissociation, the barbed end elongates slower. Images were acquired in TIRF microscopy. See Video 1. (B) Same configuration as in (A), but the filaments are exposed to a periodic alternation of different conditions: here a solution of unlabeled actin (0.3 µM actin, 50 mM KCl) for 100 s and a solution of 15% Alexa 488 labeled actin (0.5 µM actin +2 µM profilin, 50 mM KCl) for 20 s. Images were acquired in epifluorescence while exposing to unlabeled actin. See Video 2. (C) Configuration where formins are anchored to the surface by their C-terminus. Filaments were nucleated using a solution of labeled actin and elongated by flowing in a solution of unlabeled actin (here, 0.3 µM actin, at 50 mM KCl), until the filaments eventually detached and disappeared. The viscous drag applied on the filaments was kept low (<0.1 pN) by working with low flow rates. Images were acquired in epifluorescence. See Video 3. (D) Domain architecture and boundaries for the mDia1 and mDia2 formin constructs used in this study. (E) Survival fractions of mDia1(FH1-FH2-DAD) formin-bound barbed ends as a function of time, obtained from three independent experiments performed in the same conditions, in the experimental configuration shown in (A). Curves are fitted by a mono-exponential decay to obtain formin dissociation rate koff.

