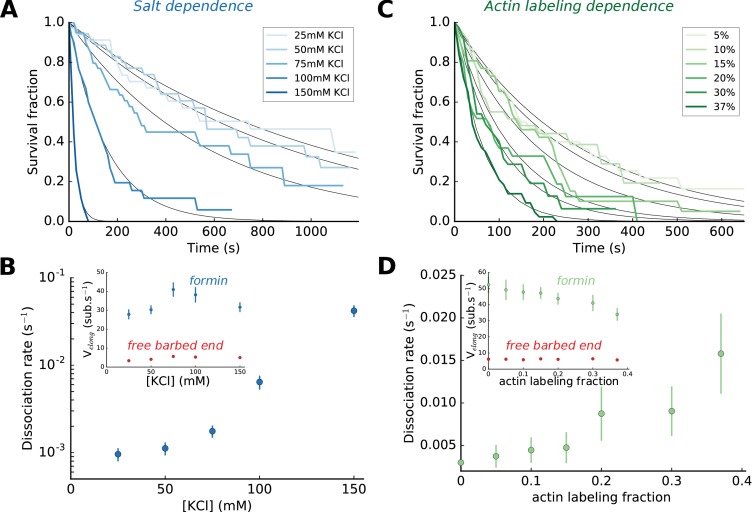
Figure 2. Impact of salt and actin labeling fraction on mDia1 formin processivity.
(A,B) Effect of salt concentration on the survival fraction of formin-bound barbed ends (A), on the formin dissociation rates (B, log-linear scale) as well as on the barbed end elongation rates (B, inset). The dissociation rates in (B) result from the exponential fits (black lines) shown in (A). Each data point corresponds to a population of 30–40 filaments. (C,D) Effect of the actin Alexa 488 labeling fraction on the survival fraction of formin-bound barbed ends (C), on the formin dissociation rates (D) and on the barbed end elongation rates (D, inset). Each data point in (D) corresponds to a population of 30–40 filaments. Error bars on formin dissociation rates indicate 65% confidence intervals based on exponential fits and sample size (see Materials and methods), and error bars on elongation rates indicate standard deviations.
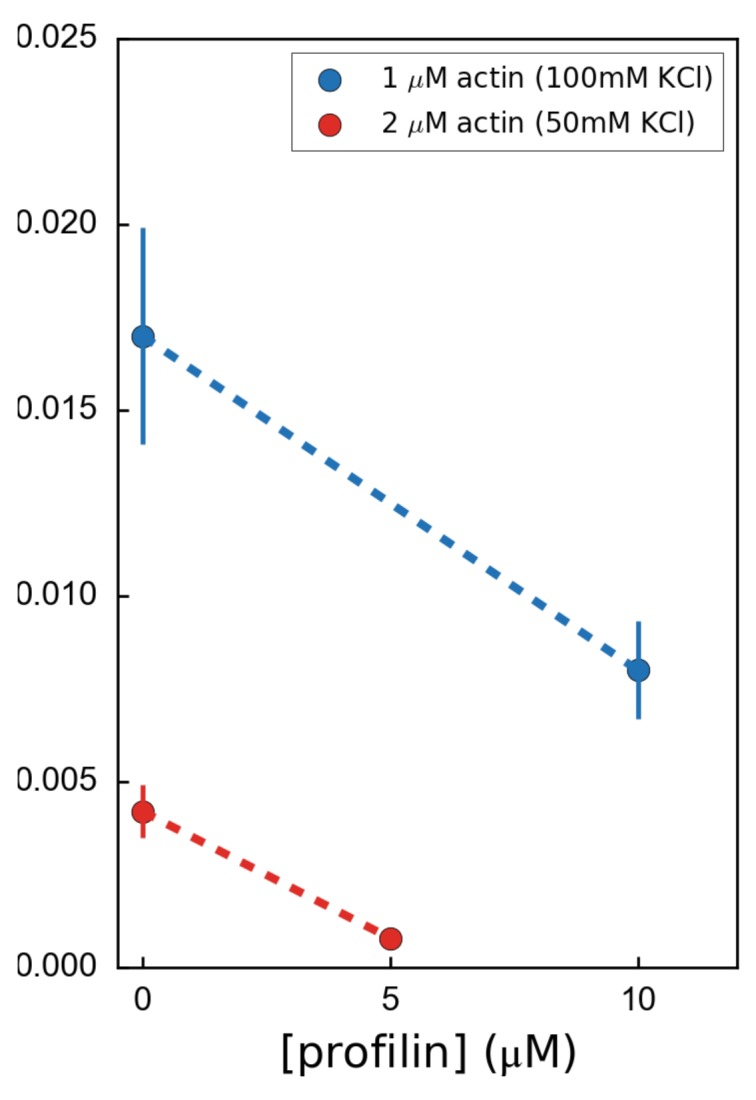
Figure 2—figure supplement 1. Variation of the formin mDia1(FH1-FH2-DAD) dissociation rate as a function of profilin concentration, for 2 µM unlabeled actin at 50 mM KCl (red) or for 1 µM unlabeled actin at 100 mM KCl (blue), showing that formin processivity is decreased by profilin with unlabeled actin, for both salt conditions.


