. 2018 May 25;7:e34176. doi: 10.7554/eLife.34176

Figure 4. Force has a great impact on formin processivity.

(A) Sketch of the experimental configuration, similar to that of Figure 1C, but where significant forces are applied using various flow rates. The applied force scales with the filament length. (B) Survival fractions of mDia1-anchored filaments, elongating with 1 µM actin +10 µM profilin, using different flow rates to reach different force ranges: each filament underwent 0.051 pN/µm (initial filament length = 4.9 µm, N = 46 filaments), 0.204 pN/µm (initial filament length = 3.2 µm, N = 49) or 0.501 pN/µm (initial filament length = 2.6 µm, N = 49) for ‘low’, ‘medium’ and ‘high’ flow rate curves, respectively. (C–E) mDia1 formin dissociation rate as a function of applied force (log-linear plots), for different actin concentrations in the absence of profilin (C); for 1 µM actin with different profilin concentrations (D); for 0.3 µM actin in presence or absence of FH1 domains (E, top); and for 1 µM actin, 4 µM profilin for mDia1 (FH1-FH2-DAD) formins either anchored by their FH1 N-terminus or FH2 C-terminus (E, bottom). Experiments were carried out by elongating the filaments with unlabeled actin, at 50 mM KCl. (F) mDia1 and mDia2 formin dissociation rates as a function of applied force (log-linear plots), for different profilin and unlabeled actin concentrations, at 100 mM KCl. Dissociation rates were obtained by local fits of the slope in survival fractions similar to the ones shown in (B) (see Materials and methods). Each data point is either obtained from a single experiment or is the average of 2–3 independent experiments. The data points at zero force were measured independently, using the configuration shown in Figure 1B (striped filaments). The error bars indicate standard deviations when several independent experiments were grouped (data from individual experiments for (C) and (D) are shown in Supp. Figure 4—figure supplement 2).

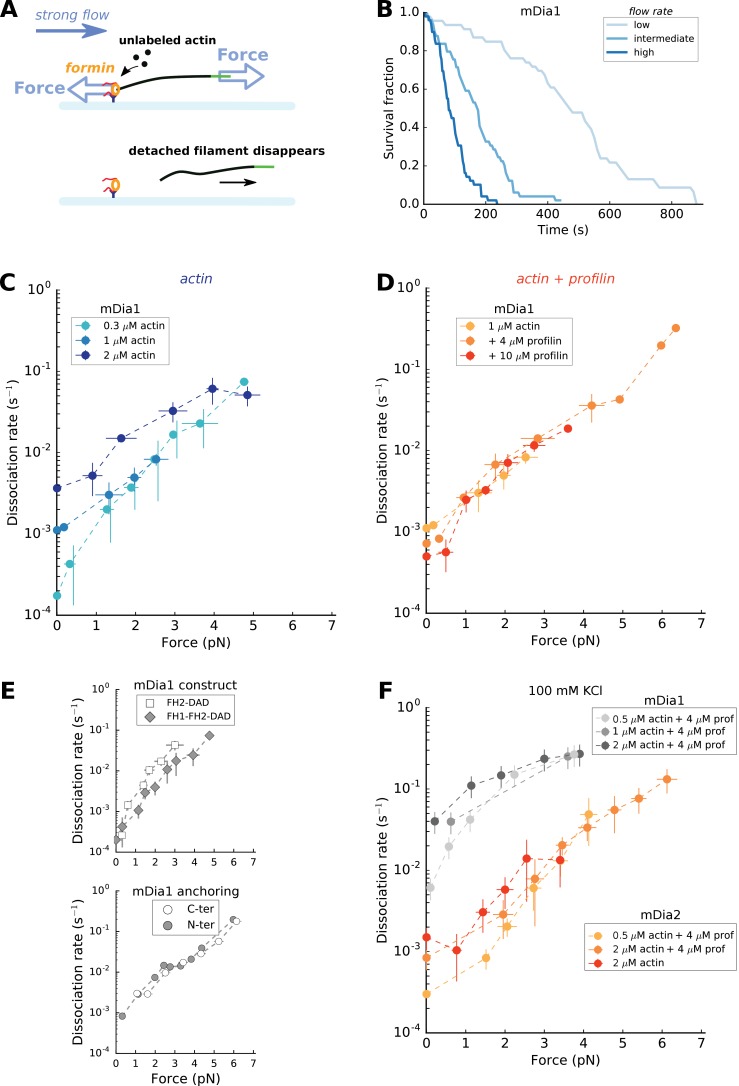
Figure 4—source data 1. Spreadsheet containing the data plotted in Figure 4, Figure 4—figure supplement 1, Figure 4—figure supplement 2, and Figure 4—figure supplement 3.
Units and conditions are indicated in the figures legends. The data are on separate sheets, as indicated on the thumbnails.
DOI: 10.7554/eLife.34176.017

Figure 4.

Figure 4—figure supplement 1. C-terminus anchored mDia1 (FH1-FH2-DAD) formin renucleation.

Figure 4—figure supplement 1.

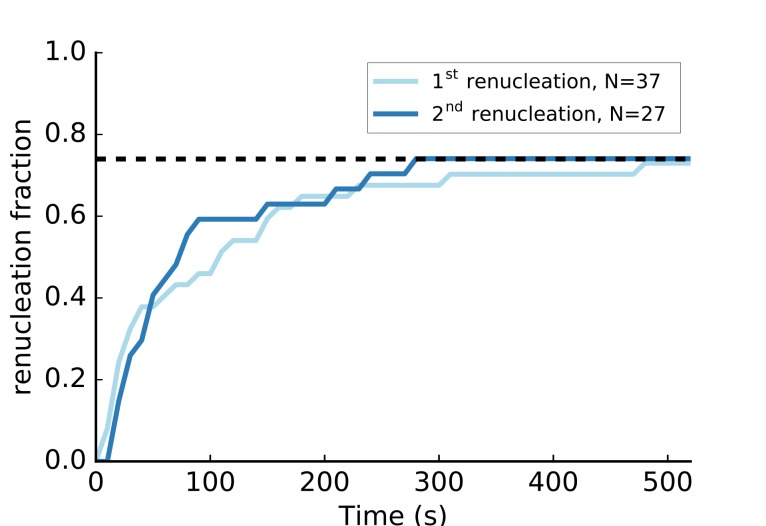
Nucleation of new filaments from surface-anchored mDia1 formins. The anchored mDia1(FH1-FH2-DAD) formins that participated in a pulling force experiment with 1 µM actin 4 µM profilin in a moderate flow (i.e. reaching a pulling force ~1–4 pN before filaments detached) as depicted in Figure 4, were subjected to a renucleation assay to assess if they were still present on the coverslip surface and functional. The renucleation assay consisted in exposing them alternatively, at the same flow rate, to a solution of F-buffer at 25 mM KCl, 2 µM 15% Alexa 488-labeled actin, 0.4 µM profilin and to a solution of F-buffer at 100 mM KCl, 1 µM unlabeled actin, 4 µM profilin, for 15 s each. The formins that were observed renucleating a filament (‘1 st renucleation’, light blue), eventually let go of that filament and could be observed nucleating another filament (‘2nd renucleation’, dark blue). The dashed line indicates that 74% of the formins had nucleated a new filament after 500 s.

Figure 4—figure supplement 2. mDia1 formin dissociates faster with force.

Figure 4—figure supplement 2.

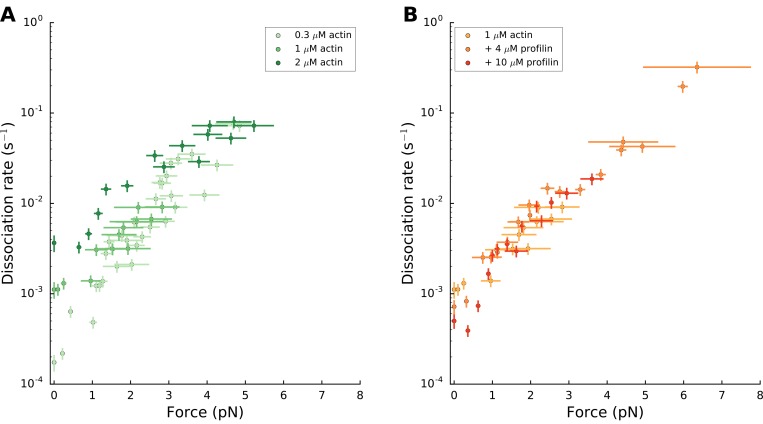
mDia1 formin dissociation rate as a function of applied force (log-linear plots): for different actin concentrations in the absence of profilin (left); for 1 µM actin with different profilin concentrations (right). Dissociation rates were obtained by local fits of the slope in survival fractions similar to the ones shown in Figure 4B (see Materials and methods). Each data point is obtained from a single experiment. Error bars indicate the standard deviations for force and the ±0.13% uncertainty on the dissociation rate, accounting for formin detachments from the surface (see Materials and methods). Grouping these data in bins of similar forces resulted in the plots shown in Figure 4C and D.

Figure 4—figure supplement 3. mDia2 formin elongation rate is mechanosensitive.

Figure 4—figure supplement 3.

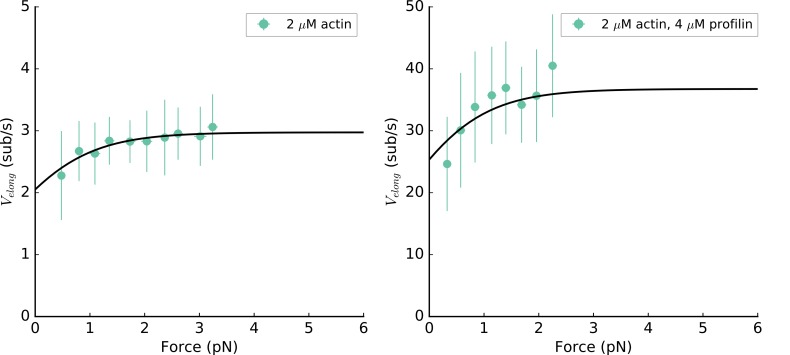
C-terminus anchored mDia2 (FH1-FH2-DAD) formin elongation rate as a function of the applied tension for 2 µM unlabeled actin in absence (left) or in presence of 4 µM profilin (right), at 100 mM KCl. Data from both conditions are simultaneously fitted, according to the model from (Jégou et al., 2013), resulting in the probability to be in the open state p0 = 69%, and kon = 1.5 and 18.4 µM−1.s−1 in the absence or presence of profilin, respectively.