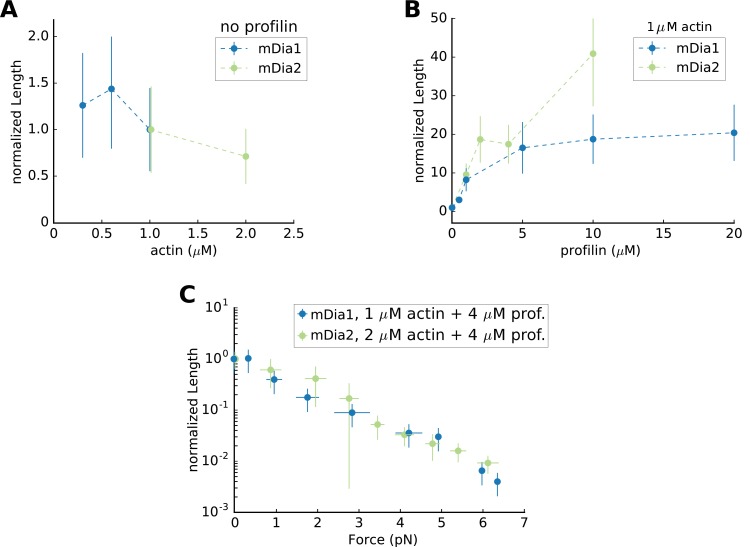
Figure 5. Mean Filament Length generated by mDia1 or mDia2 formins.
Mean flament length (A) as a function of actin concentration, in the absence of profilin, normalized by its value at 1 µM actin (which equals 0.65 µm for mDia1 and 8.22 µm for mDia2); (B) mean length as a function of profilin concentration, at 1 µM actin, normalized by its value in the absence of profilin; (C) mean length as a function of force, at 2 µM actin 4 µM profilin for mDia2, and at 1 µM actin 4 µM profilin for mDia1, normalized by its value in the absence of force (83.7 µm for mDia2 and 7.45 µm for mDia1). All data were acquired at 100 mM KCl. Error bars indicate standard deviations.

