
Figure 4. An RBP-Centered Imaging Screen Identifies Stress- and Cell-Type-Specific SG Components.
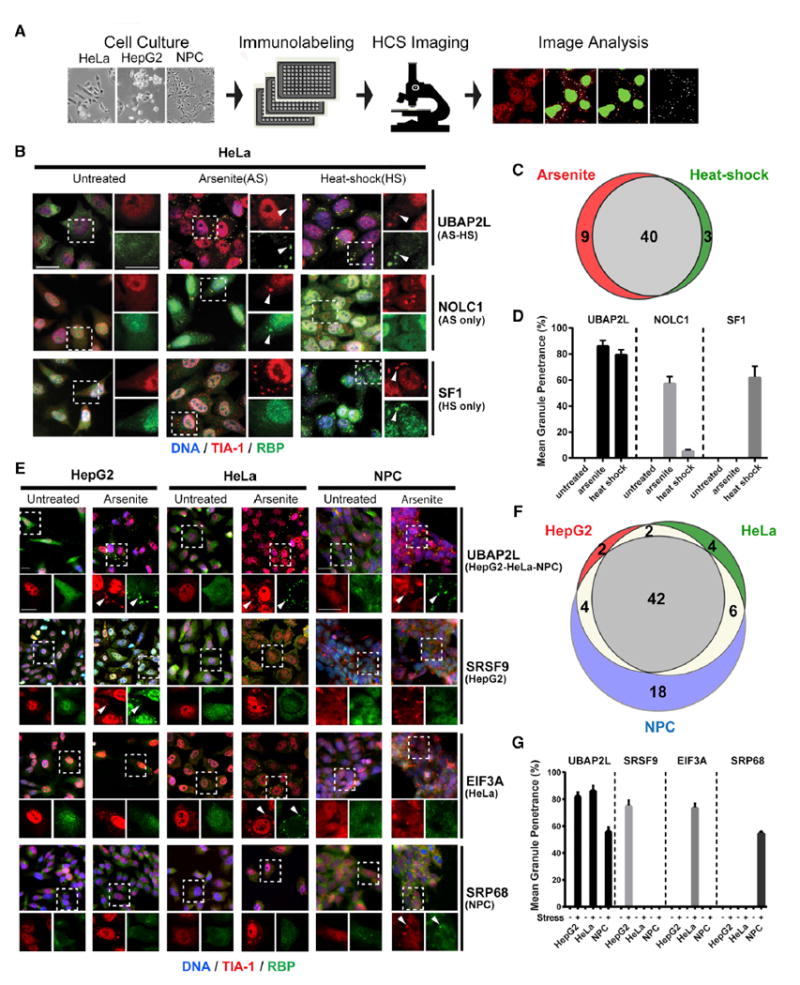
(A) High-content imaging (HCI) screen outline to identify SG-localized RBPs in HepG2 cells, HeLa cells, and NPCs.
(B) IF images showing examples of RBP localization in untreated, NaAsO2 (AS)-treated, and heat-shock (HS)-treated HeLa cells. UBAP2L is a common hit in both stress conditions; NOLC1 and SF1 are specific to NaAsO2 and heat shock, respectively. Left panels are merged lower-resolution views, and right panels represent zoomed-in views of the indicated selection separately showing TIA-1 (red) or the test RBP (green). Arrowheads indicate co-localization of the test RBP with TIA1.
(C) Venn diagram comparing SG proteins in HeLa cells treated with NaAsO2 versus heat shock.
(D) Quantification of the mean granule penetrance of proteins with either constitutive (UBAP2L) or stress-type-specific (NOLC1 and SF1) SG localization.
(E) IF images showing examples of RBP localization in untreated and NaAsO2-treated HeLa cells, HepG2 cells, or NPCs. UBAP2L is found in SGs in all three cell types, while SRSF9, EIF3A, and SRP68 are specific to HepG2 cells, HeLa cells, and NPCs, respectively. Top panels are merged lower-resolution views, while the bottom panels represent zoomed-in views of the indicated selection separately showing TIA-1 (red) or the test RBP (green). Arrowheads indicate examples of RBPs co-localized with TIA-1.
(F) Venn diagram comparing SG proteins in HepG2, HeLa and NPCs treated with NaAsO2.
(G) Mean granule penetrance of proteins with either cell-type-independent or cell-type-specific SG localization. Scale bars in (B) and (E), 20 μm. Error bars in (D) and (G) represent SD. See also Table S5.