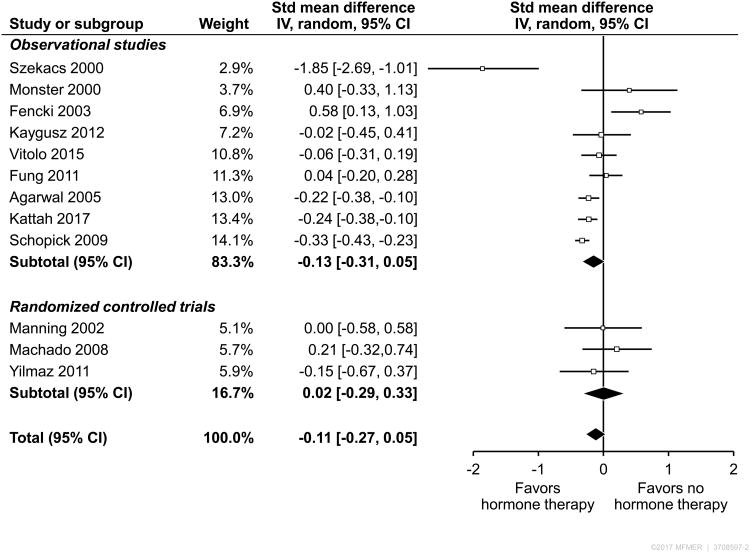
Figure 2.
Forest Plot of the standardized mean difference of the effect of hormone therapy on urine albuminuria/proteinuria in observational studies and randomized controlled trials. Each study is listed according to subgroup, with the corresponding weight, standardized mean difference and 95% Confidence Interval (CI).

