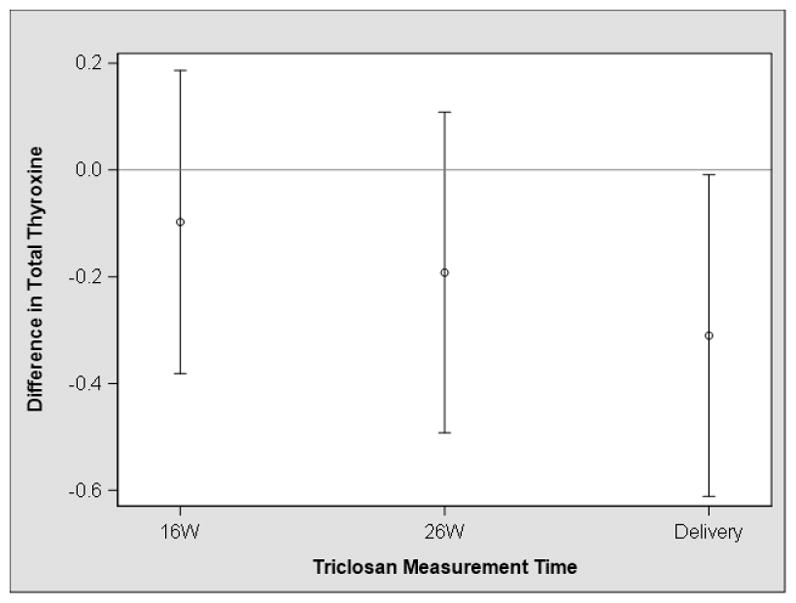
Figure 2.

Adjusted difference in neonatal cord serum total thyroxine concentrations with a 10-fold increase in urinary triclosan concentrations at 16 and 26 weeks and near the time of deliverya,b
a- Adjusted for maternal age at delivery, race, BMI at 16 weeks gestation, household income, and child sex
b-Estimates are derived from a multiple informants model that simultaneously estimates the association between each urinary triclosan concentration and serum total thyroxine concentrations. Estimates were not significantly different from one another (visit x triclosan p-value=0.33).
