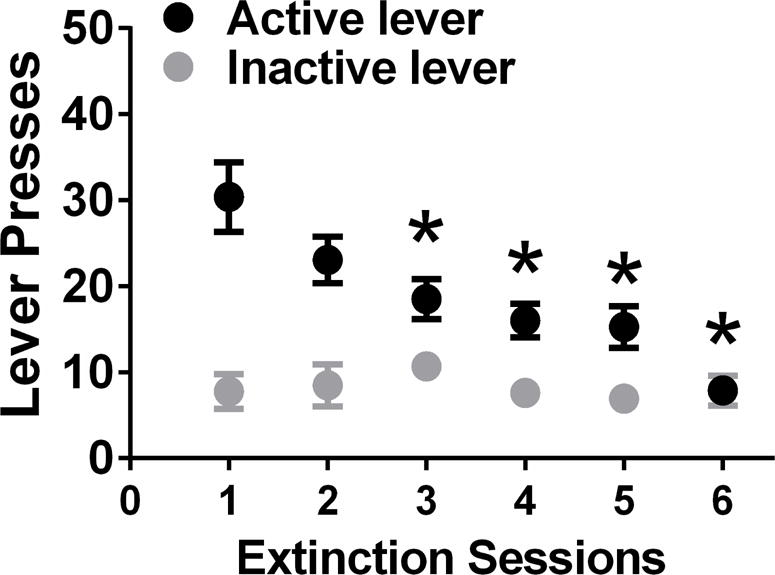
Figure 1.

(a) Schematic of experimental design indicating time frame for each type of session. Total of 5 experimental groups were used. Group 1, methamphetamine naïve controls; Group 2, methamphetamine self-administration; Group 3, methamphetamine abstinence; Group 4, methamphetamine extinction; Group 5, methamphetamine reinstatement. (b-c) Escalation of methamphetamine self-administration. (b) Lever responses during six hour methamphetamine sessions, (c) and amount of methamphetamine consumed. n = 30. Data shown are represented as mean +/− SEM. * P <0.05, compared to session 1 (b-c) by repeated measures two way analysis of variance (ANOVA) and Student-Newman-Keuls posttests.
