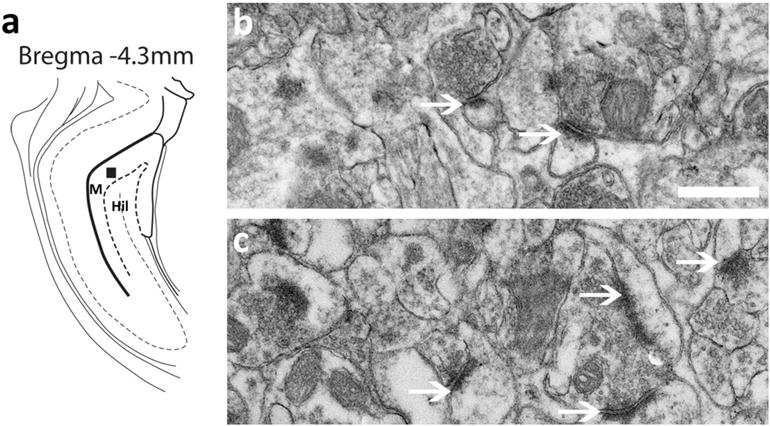
Figure 6.

(a) Schematic representation of coronal sections used for DG enriched tissue punches for Western blotting analysis. (b) Representative immunoblots of each protein measured with observed molecular weight in kDa. Rst, reinstated rats. (c) Quantitative analysis of density of proteins shown in (b). (d) Ratio of GluN2A to GluN2B. Data shown are represented as mean +/− SEM. n=11 controls, n=16 reinstated rats. *P<0.05 vs. controls by unpaired t-test.
