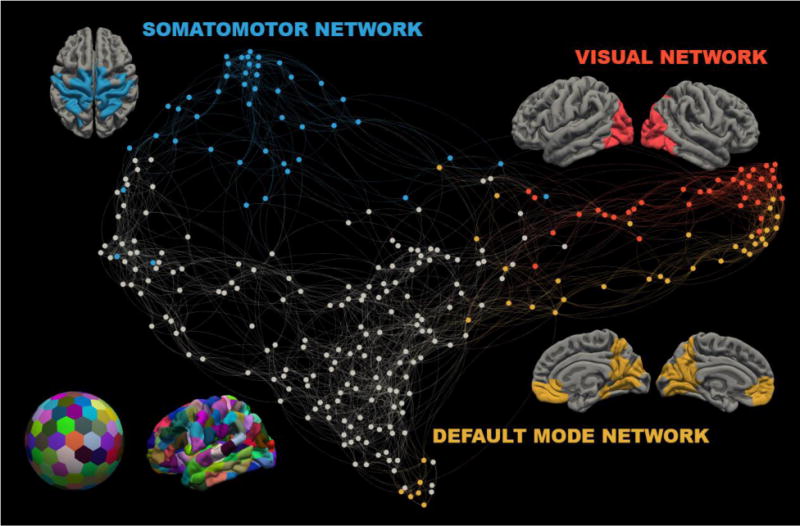
Figure 1. Parcellation and Community Detection.

Left bottom: The cortical surface was divided into two hundred ninety-two parcels of equal size and projected onto individual subject surface reconstructions. Center: A spring embedded network diagram. Node color reflects Infomap classification (blue: somatomotor network, yellow: visual network, red: default-mode network, grey nodes are unclassified). For each identified network, its elements are displayed over an average surface.
