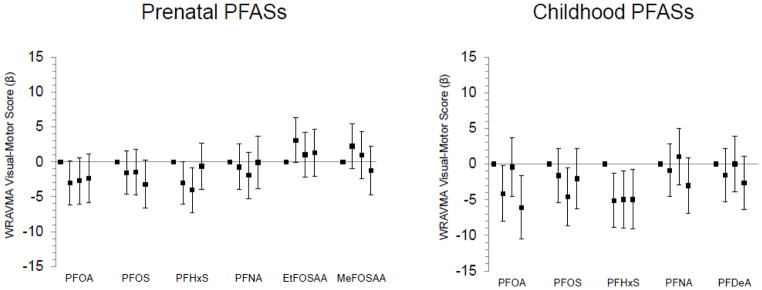
Figure 3.
Associations of prenatal and mid-childhood plasma PFAS concentrations (in quartiles) with mean differences (+95% confidence intervals) in mid-childhood (median age 7.7 years) Wide Range Assessment of Visual Motor Abilities (WRAVMA) Visual-Motor scores, adjusted for relevant covariates (n=853 for prenatal PFASs, 635 for childhood PFASs). Standard mean (SD) for WRAVMA=100 (15); higher scores indicate better performance. All models adjusted for year of blood collection, maternal race/ethnicity, age, education, and IQ, paternal education, household income, home environment, and child’s sex and age at assessment. Prenatal PFAS models additionally adjusted for: gestational age at blood collection, estimated glomerular filtration rate, maternal pre-pregnancy body mass index and smoking in pregnancy, and proxy for breastfeeding of a prior child (incorporating parity). Childhood PFAS models additionally adjusted for: breastfeeding duration (months up to 12) and maternal parity.

