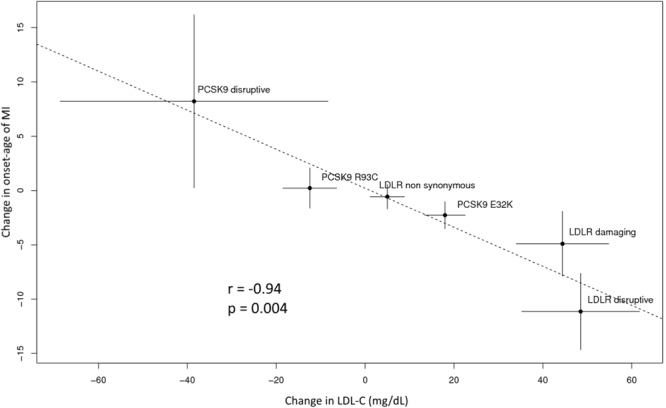
Figure 2.

Effects of LDLR and PCSK9 rare variants on LDL-C levels and onset age of MI. Dots represent the change from non-carriers of LDLR/PCSK9 rare variants for each group and lines indicate the 95% confidence interval. Effects were estimated using multiple linear regression models adjusted for age, gender, BMI, smoking status and cholesterol lowering medications in assessing LDL cholesterol levels, and controlling for the same parameters except age in assessing onset age of MI. Abbreviations: r: Pearson’s correlation coefficient.
