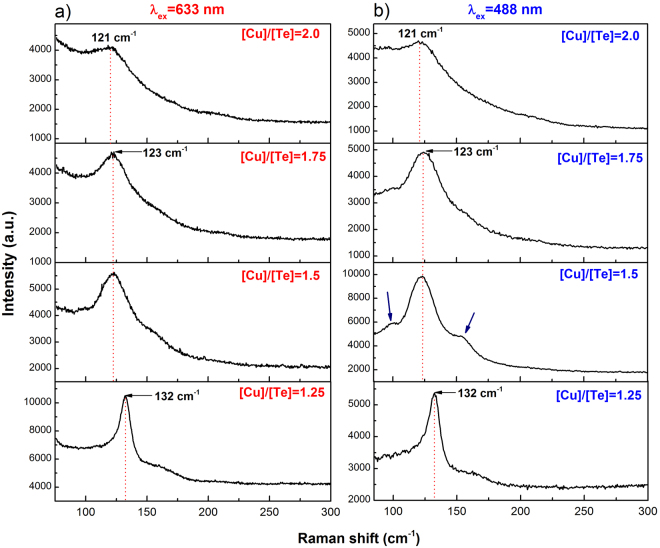
Figure 5.
(a) Raman spectra of the copper telluride films obtained for the laser excitation line of λex = 633 nm. (b) Raman spectra of the thin films measured with λex = 488 nm. Besides the main peak, in the spectrum of the film grown from the [Cu]/[Te] = 1.5 two vibrational modes (indicated by the arrows) have intensities larger than the monotonically decaying signal (MDS) observable in all spectra. These two modes at the sides of the main peak have higher relative intensity than in the corresponding spectrum in Fig. 5a. This is an indication that resonance conditions (i.e. band-to-band transitions) are better matched when the excitation line λex = 488 nm (2.54 eV) is used.

