Figure 1.
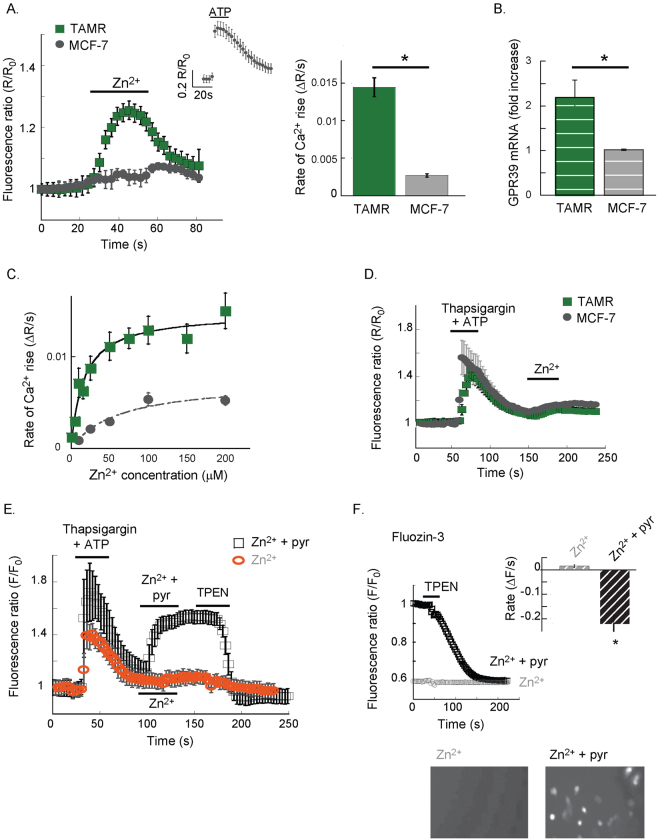
Extracellular Zn2+ triggers Ca2+ responses in TAMR but not in MCF-7 cells. (A) TAMR or MCF-7 cells, loaded with Fura-2, were imaged, and Zn2+ (200 μM) was applied at the indicated time. Representative Ca2+ response averaged over 10–15 cells is shown (left panel). The average rate of signal rise is shown in the bar graph (right panel, n = 5 slides for each condition in 4 independent experiments, p < 0.05 t-test). Inset shows a representative Ca2+ response triggered by the purinergic metabotropic receptor agonist, ATP (25 μM). (B) Quantitative PCR analysis of GPR39 mRNA levels in the MCF-7 versus TAMR cells (n = 3, p < 0.05 t-test). (C) Dose response analysis of the Zn2+-dependent Ca2+ response in Fura-2 loaded cells was performed, using the paradigm described in A, for TAMR and MCF-7 cells (n = 4, p < 0.05 t-test). (D) Using thapsigargin (200 nM) and ATP (25 µM), as indicated, the intracellular Ca2+ stores were depleted, and subsequent baseline fluorescent signal indicated removal of cytoplasmic Ca2+. Then, Zn2+ was applied as in A; representative traces from TAMR and MCF-7 cells are shown. (E) Ca2+ stores were depleted as in D., and Zn2+ (200 μM) was applied in the presence (black) or absence (orange) of the ionophore pyrithione (5 μM). The cell permeable chelator TPEN (10 μM) was finally added. Representative response of Fura-2 signal is shown. (F) Cells loaded with the Zn2+-sensitive dye, FluoZin3, were pre-treated with Zn2+ alone or in the presence of pyrithione (5 μM, 2 min). Cells were then imaged and TPEN (10 μM) was applied, representative traces are shown. Averaged rates of fluorescence decrease are shown in the insert (n = 5 coverslips in 4 independent experiments, p < 0.05 t-test). Bottom panel shows representative images of FluoZin-3 fluorescence in cells pre-treated with Zn2+ alone or in the presence of pyrithione (5 μM, 2 min).

