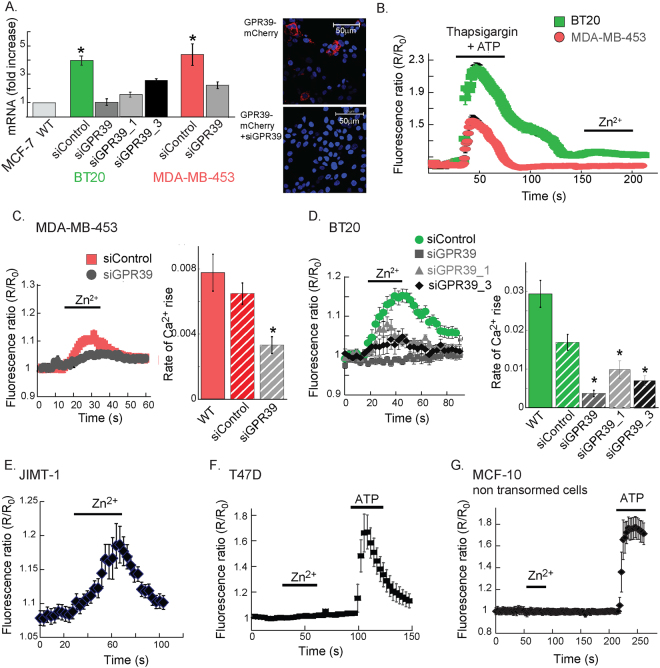
Figure 3.
ZnR/GPR39 signaling is found in estrogen independent cell lines. (A) The mRNA level of GPR39 was determined using q-PCR in MCF-7, BT20 and MDA-MB-453 breast cancer cells, following transfection with siGPR39 constructs or scrambled (siControl) constructs (n = 3 for each cell line, p < 0.05 t-test). Right panel shows HEK293 cells transfected with mCherry-tagged GPR39 with siSCR or siGPR39 co-transfection, indicating that the siGPR39 efficiently attenuates ZnR/GPR39 expression. Representative confocal images showing Dapi (blue) nuclear staining and mCherry (red) indicating ZnR/GPR39 expression, which was abolished by siGPR39. (B) Fura-2 fluorescence was monitored in BT20 and MDA-MB-453 cells following Ca2+ store depletion (using 200 nM thapsigargin and 25 µM ATP, as in Fig. 1C), and application of Zn2+ (200 µM). (C) Representative Ca2+ response from siGPR39 or siControl MDA-MB-453 cells loaded with Fura-2 following application of Zn2+ (200 μM, at the indicated time). Average initial rates of the Ca2+ responses are shown in the right panel (n = 4 coverslips for each condition, in 3 independent experiments, p < 0.05 ANOVA). (D) Representative Ca2+ response to application of Zn2+ (200 μM, at the indicated time) in BT20 cells, loaded with Fura-2, transfected with several siGPR39 or siControl constructs. Average initial rates of the Ca2+ responses are shown in the right panel (n = 4 coverslips for each condition, in 3 independent experiments for WT, siGPR39 and siControl and 2 independent experiments for siGPR39_1 and siGPR39_2, p < 0.05 ANOVA). (E–G). Representative Ca2+ responses obtained as in C. using JIMT-1 (E); T47D (F); or MCF-10A (G) cells loaded with Fura-2 and treated with Zn2+ (200 μM) and ATP (25 µM), as indicated. (n = 3 coverslips for each condition, in 2 independent experiments).

