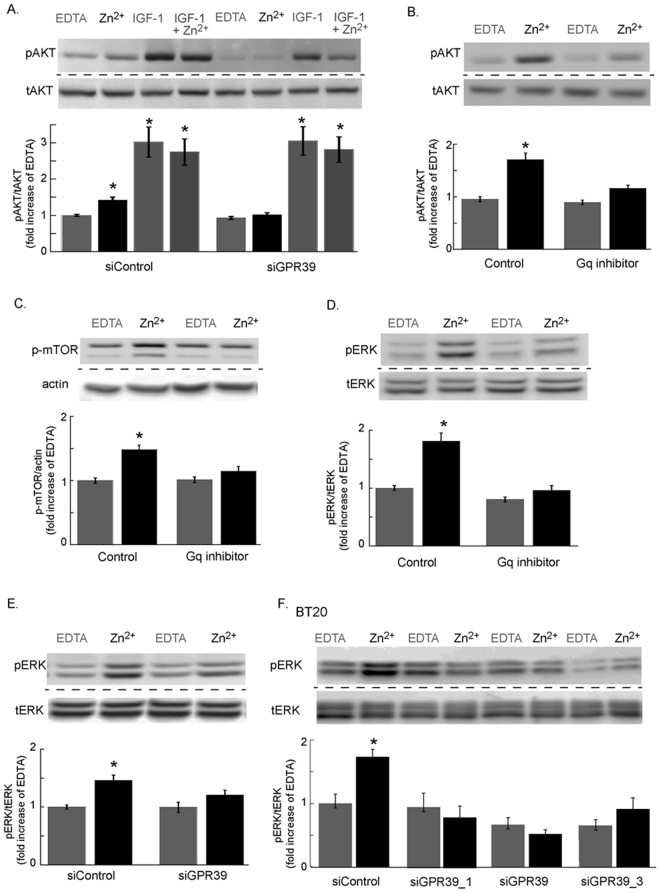
Figure 5.
Activation of PI3K and MAPK pathways by ZnR/GPR39 in estrogen independent breast cancer cells. (A) Immuno-blots of phospho and total AKT in TAMR cells transfected with siGPR39 or siControl and treated with Zn2+ (200 μM) or IGF-1 (100 nM) or a combination of Zn2+ and IGF-1 or EDTA (100 μM) as control (top panel). Bottom panel shows densitometry analysis. (B) Immunoblot and denistometry analysis of pAKT and tAKT, as in A, of TAMR cells treated with or without the Gαq inhibitor, YM-254890 (1 μM, 30 min) and following Zn2+ (200 μM) application. (C) Immunoblot and denistometry analysis of phospho-mTOR levels in TAMR cells treated with or without the Gαq inhibitor, YM-254890 (1 μM, 30 min) and following Zn2+ (200 μM) application. (D) Immunoblot and densitometry analysis of pERK1/2, relative to total ERK1/2 in TAMR cells treated with or without the Gαq inhibitor, YM-254890 (1 μM, 30 min) and following Zn2+ (200 μM) application. (E) Immunoblot and denistometry analysis of pERK1/2, relative to total ERK1/2 in TAMR cells transfected with siGPR39 or siControl and treated with or without Zn2+ (200 μM). (F) Immunoblot and denistometry analysis of pERK1/2, relative to total ERK1/2 in BT20 cells transfected with several siGPR39 constructs or siControl and treated with or without Zn2+ (200 μM) (n = 2 independent experiments). Densitometry quantification in the bar graphs are averages of at least n = 3 independent experiments performed in triplicates for each condition (p < 0.05 ANOVA). Each blot presented was cropped from one original blot at one exposure. Original, full blots are presented in supplementary material.

