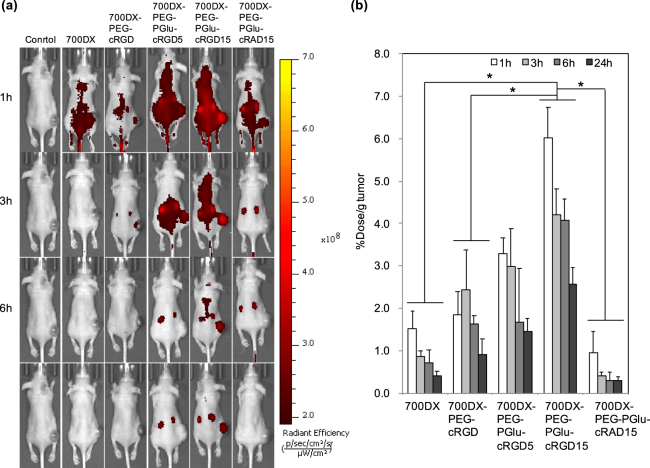
Figure 4.
Biodistribution of PSs. (a) When the tumor size reached approximately 400 mm3, U87MG tumor-bearing BALB/c mice were intravenously injected with PSs (10 μg 700DX/mouse). IVIS images were obtained at 1, 3, 6 and 24 h after injection. (b) Biodistribution of PSs in tumor quantified by fluorescence intensity and expressed as a percentage of the injected dose/g tissue. The results are expressed as mean ± S.D. (n = 4). Statistical analysis was performed using two-way ANOVA with Holm-Sadic method (*p < 0.001).

