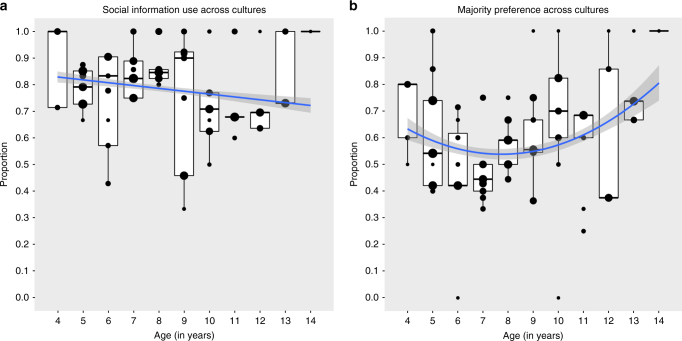
Fig. 1.
The ontogeny of social learning in human children. Depicted are a children’s reliance on social information (vs. innovation), and b majority (vs. minority) preference, across cultures. Blue lines represent ontogenetic trajectories across cultures; shaded area around the blue lines represent 95% confidence intervals. Medians are represented by the bold, horizontal lines within the boxes. The boxes represent the interquartile range (IQR), the vertical lines attached to the boxes represent Q1–1.5 IQR (lower) and Q3 + 1.5 IQR (upper). Dot size in a is proportional to the number of observations in ratio 1:5, with minimum and maximum number of observations per dot being 1 and 33, respectively. Dot size in b is proportional to the number of observations in ratio 1:5, with minimum and maximum number of observations per dot being 1 and 24, respectively

