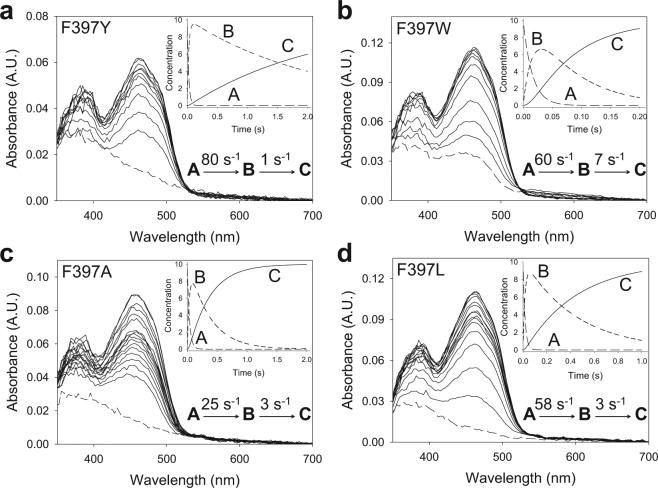
Figure 4.
Time course of reoxidation of Phe397 variants with O2. (a) F397Y spectra measured at 0.002, 0.01, 0.02, 0.03, 0.04, 0.05, 0.06, 0.07, 0.08, 0.5, 1 and 1.5 s after mixing. (b) F397W recorded at 0.001, 0.005, 0.01, 0.02, 0.03, 0.04, 0.05, 0.06, 0.07, 0.08, 0.09, 0.1, 0.18 and 0.2 s. (c) F397A recorded at 0.002, 0.01, 0.02, 0.03, 0.04, 0.05, 0.06, 0.07, 0.08, 0.09, 0.5, 1, and 1.5 s. (d) F397L recorded at 0.002, 0.01, 0.02, 0.03, 0.04, 0.05, 0.06, 0.07, 0.08, 0.09, 0.1, 0.3, 0.5, 0.7, 0.9 and 1 s. Enzyme (~10 µM) reactions with O2 (136 μM) were performed in 50 mM sodium phosphate, pH 6.0, at 12 °C. Dashed lines correspond to the reduced enzymes. Insets show the evolution of species A, B and C after data fitting to a two-step process. The estimated kobs for each phase is represented in each panel.

