Figure 5.
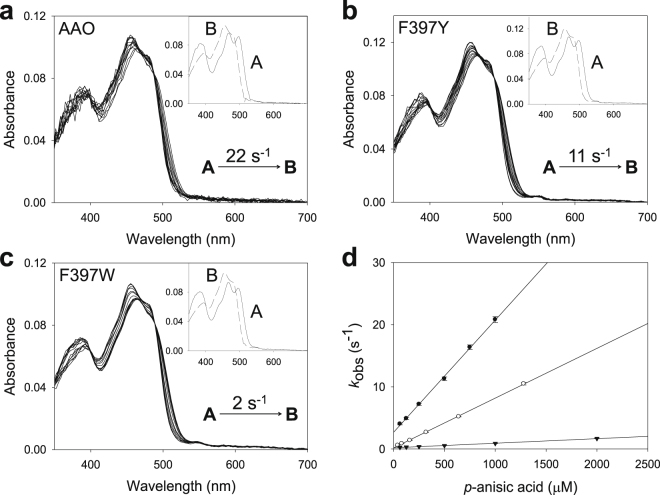
Spectral changes during formation of AAO:p-anisic acid complex. (a) Native AAO, mixed with 0.5 mM of the ligand at 0.003, 0.01, 0.02, 0.03, 0.04, 0.05, 0.065, 0.085, 0.1, 0.13, 0.15, 0.2 and 0.4 s. (b) F397Y, mixed with 0.65 mM of p-anisic acid measured after 0.005, 0.05, 0.1, 0.2, 0.3, 0.4, 0.5, 0.6, 0.7, 0.8, 0.9, 1, 2, 3 and 4 s, and (c) F397W mixed with p-anisic acid 1 mM recorded at 0.005, 0.02, 0.04, 0.05, 0.07, 0.1, 0.2, 0.4, 0.5, 0.7, 1, 2 and 5 s. Insets show disappearance of initial species A and formation of final species B. The rate constant obtained from the global fitting of the spectral changes is shown. (d) Fits of the obtained kobs for each variant and ligand concentration to equation (6). Native AAO (filled circles), and F397Y (open circles) and F397W (inverted triangles) variants.

