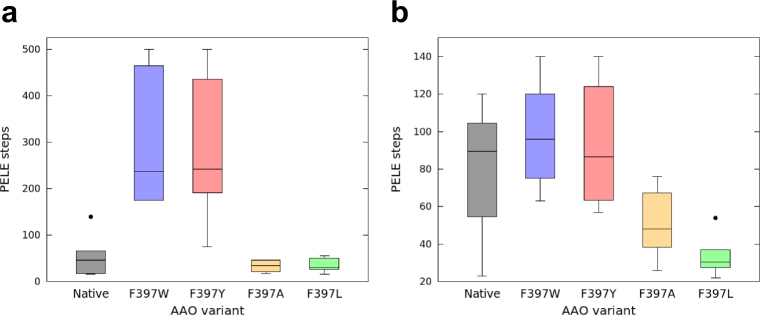
Figure 6.
Boxplots of PELE steps required for ligand release from AAO and its Phe397 variants. (a) p-Anisic acid. (b) p-Anisaldehyde. Number of PELE steps is directly related to time. Grey, native AAO; blue, F397W; red, F397Y; yellow, F397A; and light green, F397L variants. Boxes contain 50% of the results (two quartiles), horizontal lines inside them indicate the mean value; while the upper and lower whiskers (vertical lines) contain the remaining quartiles (50%). The overall height of boxes (whiskers included) is indicative of the spread of the results. Isolated points represent results significantly different from the rest of data values.

