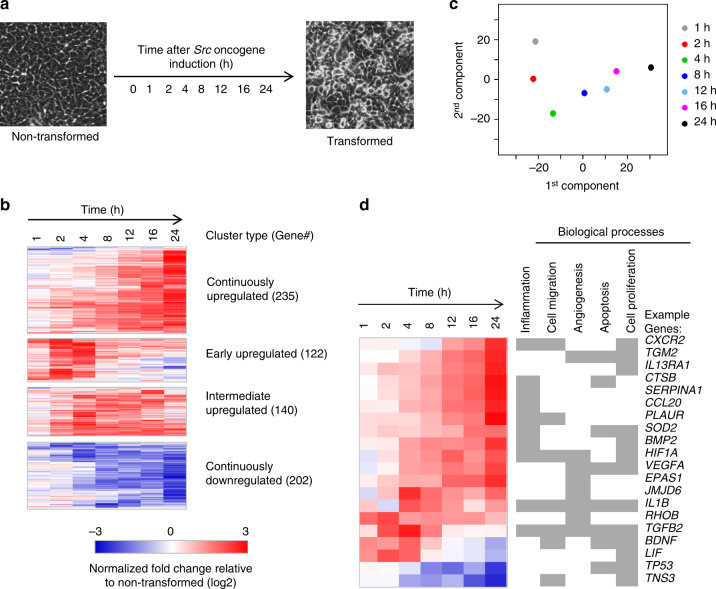
Fig. 1.
Differential gene expression during transformation. a Time-series of cells treated with tamoxifen for 0 h, 1 h, 2 h, 4 h, 8 h, 12 h, 16 h, and 24 h. b The K-mean clustering of 699 differentially expressed genes into four coherent clusters. c Principal component analyses of differential RNA expression profile. d Example genes in pathways enriched with differentially expressed genes. One gene may regulate several oncogenic processes as indicated in gray color

