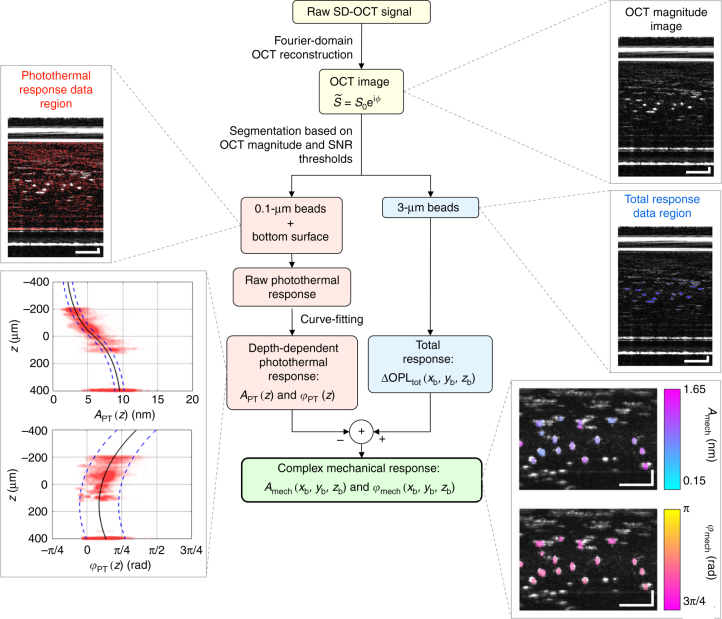
Fig. 3.
Data-processing flow chart outlining key steps to isolate the mechanical response in PF-OCE. The OCT image was segmented into total response data region (3-μm beads) and photothermal response data region (0.1-μm beads and bottom surface of the sample chamber) with magnitude and SNR thresholds (Supplementary Table 2 provides exact values of the thresholds used in the presented experiments). Magnitude and phase of raw photothermal response data were fit to a theoretical photothermal response curve and a cubic polynomial function, respectively, to obtain depth-dependent photothermal response, given by amplitude APT (z) and phase φPT (z). The mechanical response of each 3-μm bead, given by amplitude Amech (xb, yb, zb) and phase φmech (xb, yb, zb), where (xb, yb, zb) are the set of pixel coordinates corresponding to each 3-μm bead, was isolated after subtracting the photothermal response at corresponding depths from the measured total response. Example images from a 0.4% agarose hydrogel dataset are provided at each key processing step

