Figure 1.
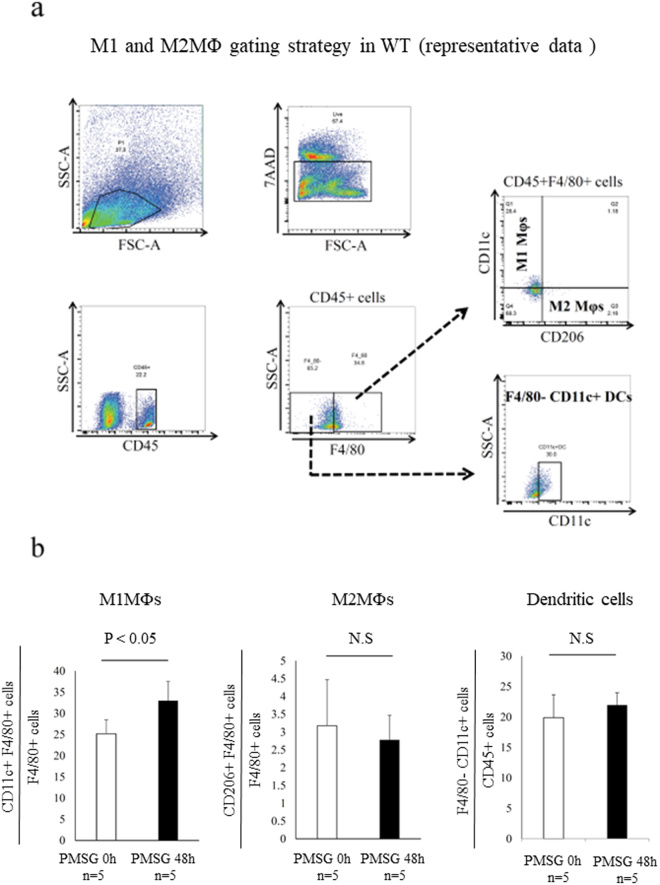
M1 and M2 macrophages (MΦs) in wild type (WT) mice ovary. (a) Representative flow cytometry analysis of M1 and M2 MΦs in the WT mice ovary. M1-like MΦ was defined as CD45+/F4/80+/CD11c+/CD206− cells, and M2-like MΦ was defined as CD45+/F4/80+/CD206+/CD11c− cells and Dendritic cells (DCs) was defined as F4/80− CD11c+ cells. (b) The proportion of CD11c+F4/80+ cells, M1-like MΦs (left panel) and CD206+ F4/80 cells, M2-like MΦs (middle panel) and F4/80− CD11c+ cells, DCs (right panel) in ovary. The proportion of M1-like MΦs significantly increased following follicular induction with PMSG 48 h, while that of M2-like MΦs and DCs was not increased. The data are shown as the means ± standard error of the mean (SEM). A P-value of < 0.05 was considered statistically significant by Mann-Whitney U test. N.S; not significant compared to WT mice. n; the number of mice.

