Figure 5.
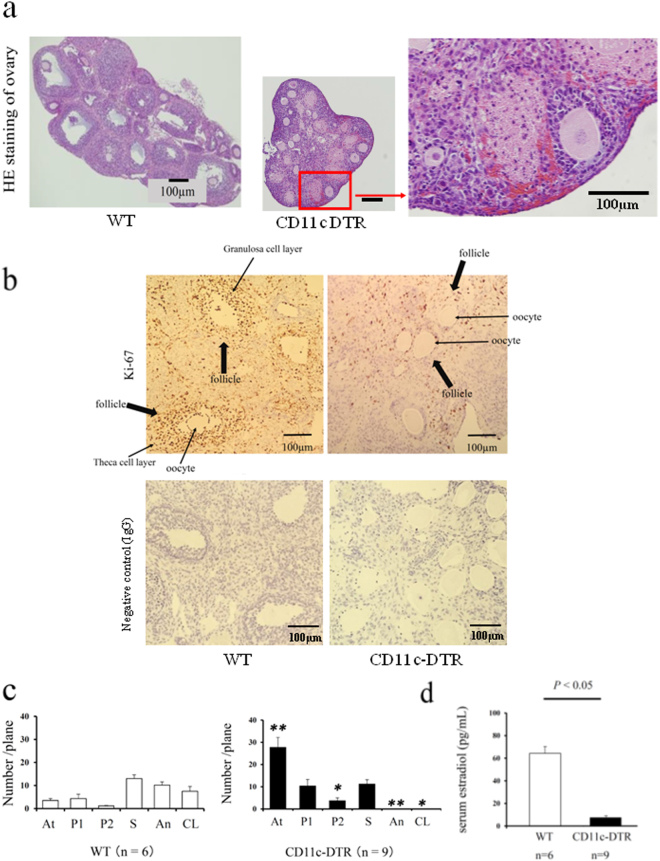
The involvement of CD11c+ cells, M1 macrophages (MΦs) and dendritic cells (DCs) in folliculogenesis. (a) The Hematoxylin Eosin (HE) staining of ovaries in follicular induction with PMSG 48 h in Wild Type (WT) (left Panel) and CD11c diphtheria toxin receptor (DTR) mice (middle). (b) The Ki-67 staining, a cell proliferation marker, in follicular induced ovary with PMSG 48 h in WT and CD11c DTR mice. Negative control data are also shown. (c) The number of each follicle stage in follicular induction in WT and CD11c DTR mice. We counted the number of follicles at each stage, such as atresia (At), primordial (P1), primary (P2), secondary (S), antral (An), and corpus luteum (CL) in CD206 DTR (right panel) and WT (left panel) mice, as previous described32. (d) The serum estradiol levels after 48 h PMSG in WT and CD11c DTR mice. The data are shown as the means ± SEM. A P-value of < 0.05 was considered statistically significant by Mann–Whitney U test. n; the number of mice. N.S: not significant compared to WT.

