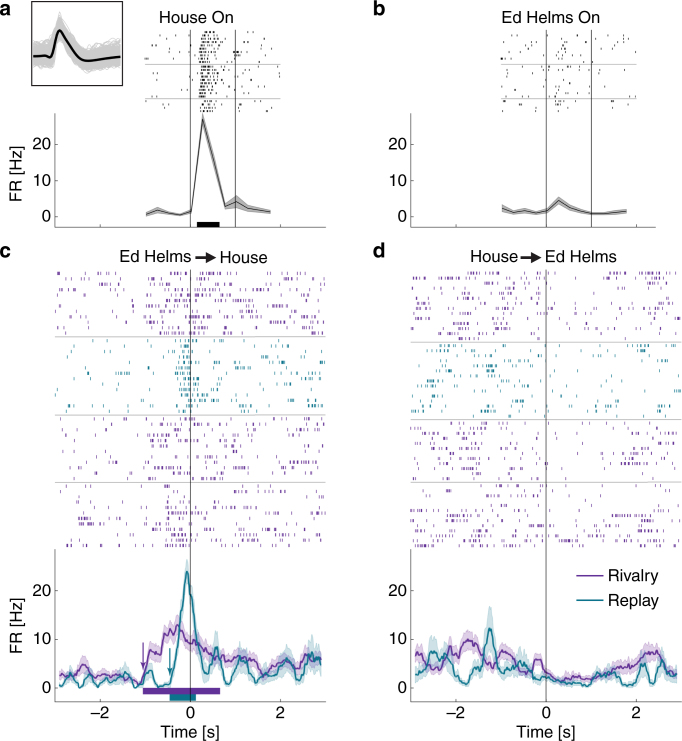
Fig. 2.
Activity of a single-unit in parahippocampal gyrus during rivalry and replay. a, b Responses to the non-rivalrous presentation of a house (a) or the actor Ed Helms (b) images. Raster plots (order of trials is from top to bottom) and post-stimulus time histogram (PSTH; 250 ms bins) are given for each image; vertical lines indicate image onset and offset; horizontal lines separate different blocks; black horizontal bars denote significant activity relative to baseline. Inset presents waveforms of this unit. c Neuronal firing around the report of transition onset to the house image (t = 0; end of Ed Helms image exclusive dominance) during rivalry (purple) and replay (cyan). PSTHs are computed with a moving square-window of 200 ms. Shaded areas represent standard error (SE). Purple and cyan horizontal bars denote periods where the instantaneous FR was significantly different than baseline in rivalry and replay, respectively (onset of these periods marked by arrows). Note the earlier activation during rivalry as compared to replay. d Neuronal firing around the report of transition onset to the Ed helms image

