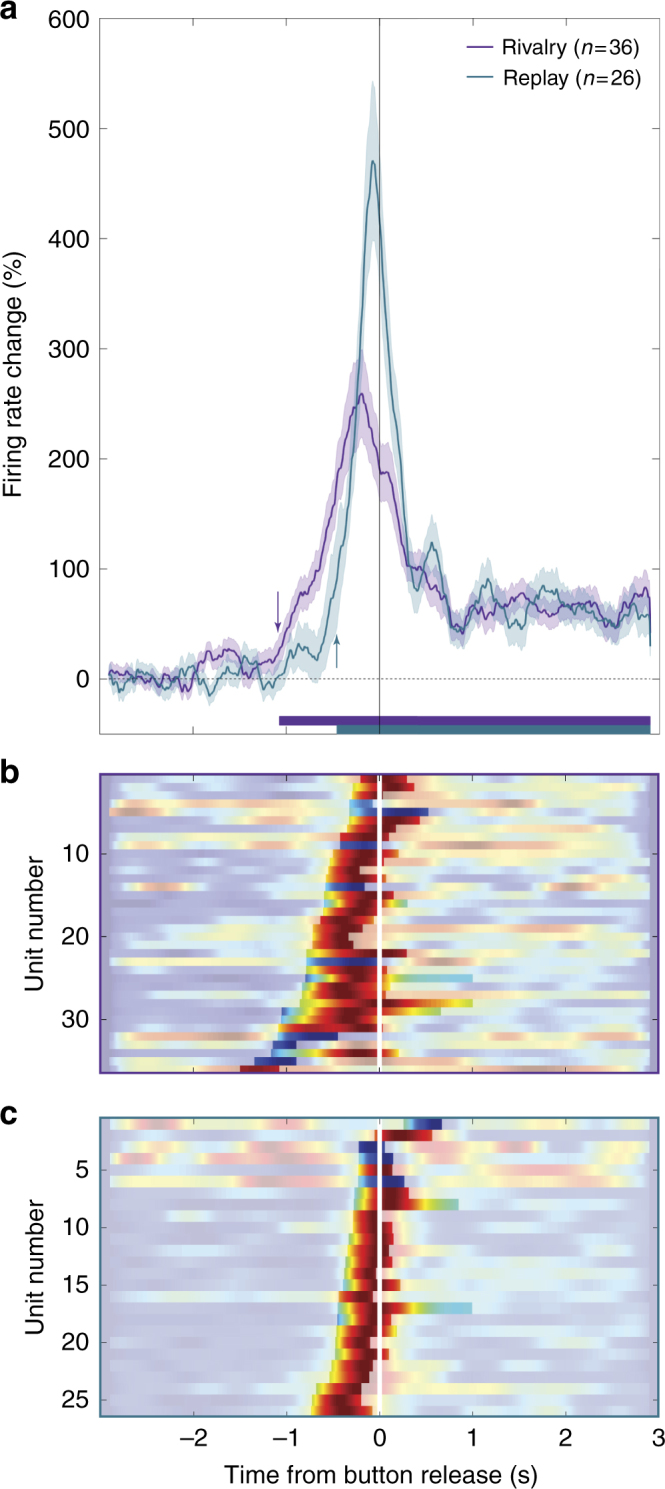
Fig. 4.

MTL population-level activity started earlier during rivalry than during replay. a FR percent change (mean ± SE) around the report of perceptual transition onset to the preferred image is averaged across all MTL rivalry-active (purple; n = 36) and replay-active traces (cyan; n = 26). Traces with significant decrease below baseline FR (n = 8 rivalry-active and n = 4 replay-active traces; see bluish highlighted periods in (b) and (c)) were inverted to enable averaging. Thick horizontal bars denote times where population activity significantly diverged from baseline (onset of these periods marked by arrows); note the ~600 ms difference in onset between rivalry and replay. The normalized FR time courses used to create the average responses are presented in color code (dark blue = 0; dark red = 1) for all MTL rivalry-active (b) and replay-active (c) units, with periods of significance at the unit level highlighted
