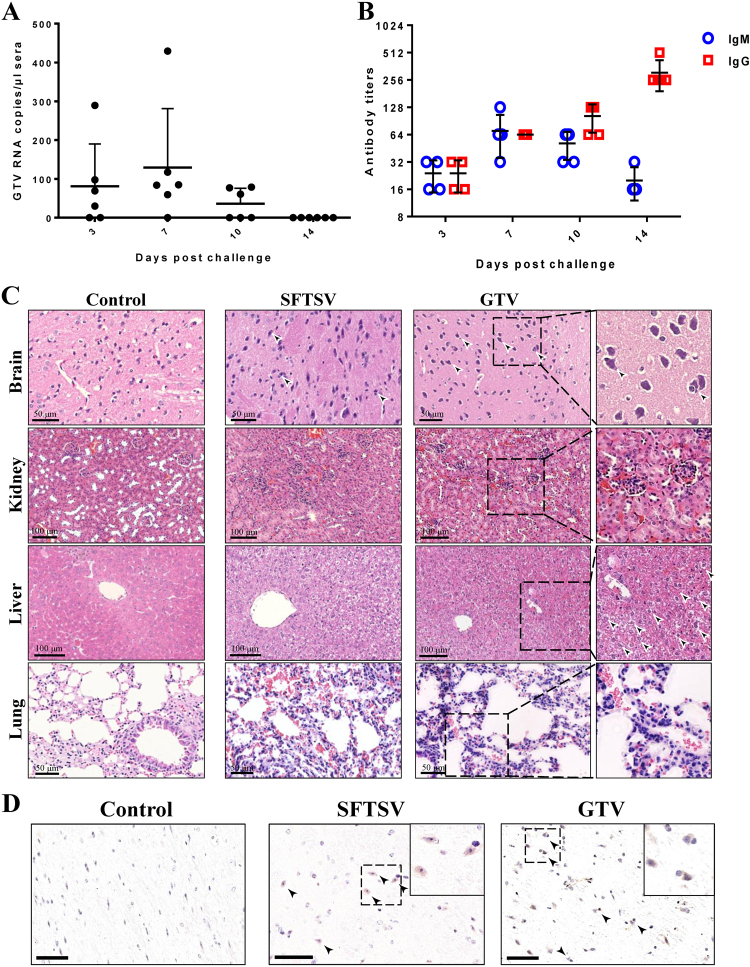
Fig. 7. The pathogenicity of GTV infection in C57/BL6 adult mice.
a qRT-PCR detection of GTV RNA copies in sera collected on the indicated day after challenge. Each dot represents the RNA copies per microliter of sera from each mouse. Data are presented as the means + SD. b IgM and IgG antibody expression in sera from mice collected on the indicated day after challenge. Sera were twofold serially diluted using an end-point dilution assay. The titers are expressed as reciprocals of the dilution, the OD values from which are three time higher than the negative control. The antibody titers are shown with the corresponding symbols with means ± SD. c The pathological changes in organs from mice infected with GTV or SFTSV. Representative H&E staining tissue sections are presented, including for the brain, kidney, liver, and lung. Areas of interest are enlarged on the right, and significant changes are indicated by arrows. d Identification of GTV and SFTSV antigen expression in mouse brains. GTV NP and SFTSV NP expression was identified by IHC in the brains of mice at day 14 post infection. Representative images are shown, and the areas of interest are enlarged on the right. The neurons expressing viral antigen or being sieged by microglial cells are indicated by arrows. Bars, 50 μm

