Figure 3.
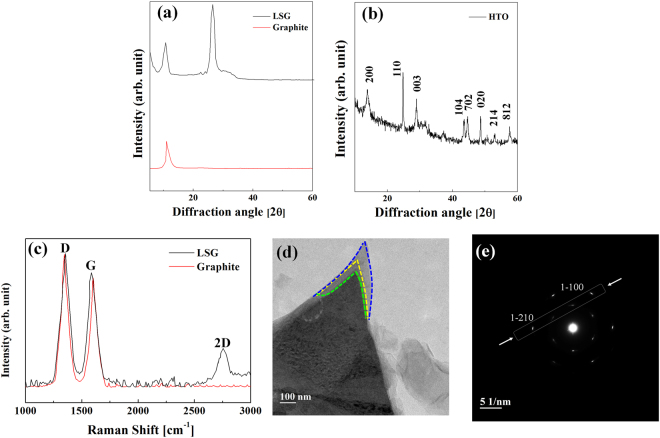
Structural and morphological characterization of as-synthesized LSG, GO and H-HTO. (a) XRD patterns of LSG and GO. The diffraction peak (2θ = 26.44°) indicates that GO is reduced to LSG (b) XRD patterns of HTO (c) Raman spectra of LSG and GO. There are D peak at 1355 cm−1, G peak at 1586 cm−1 and 2D peak at 2755 cm−1, which corresponds to graphene. (d) TEM image of LSG, showing its three layers (e) SAED patterns of the LSG where a few typical Bragg reflections are also indexed.

