
Figure 1.
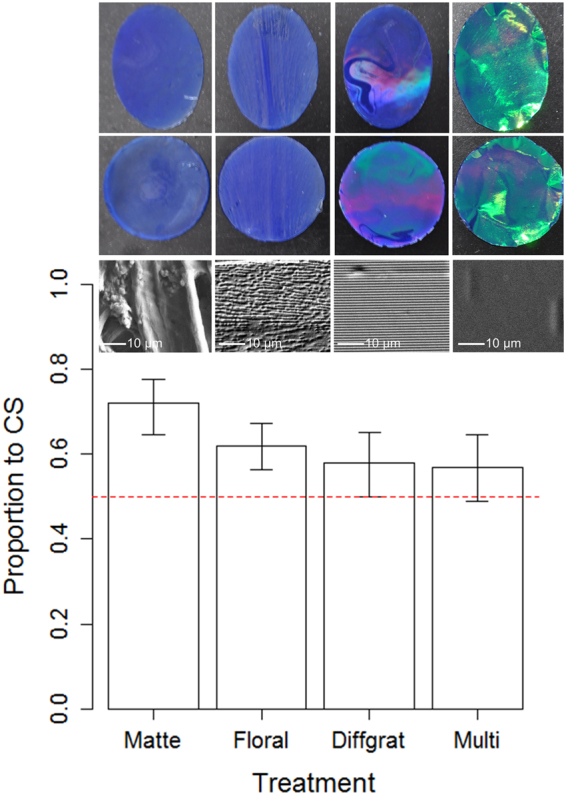
Experimental stimuli and results. Mean (±95% CI) proportion of visits to the conditioned stimuli for each treatment group, with corresponding photos (top two rows) and high magnification surface eSEM images (bottom row) of the four different treatment groups (from left to right; Matte, Floral diffraction grating, synthetic Diffraction grating and Multi-layer interference). The dashed line indicates the 50% expectation (i.e. the expected success rate for random foraging).