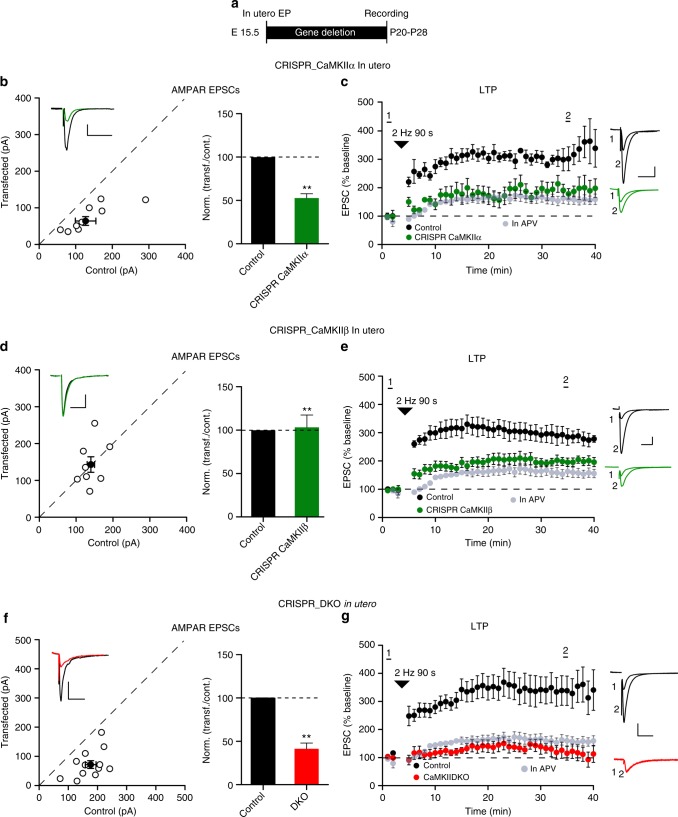
Fig. 2.
Elimination of CaMKII blocks LTP. a Experimental timeline. b Scatterplot and bar graph of ratios normalized to control of the AMPAR EPSCs for single pairs (open circles) of control and transfected CRISPR_CaMKIIα cells. Filled circle represents mean amplitude ± SEM (Control = 127.3 ± 28.9; CRISPR_CaMKIIα = 67.29 ± 12.7, n = 8 pairs, p = 0.015). Bar graph of ratios normalized to control (%) summarizing the mean ± SEM of AMPAR EPSCs (51 ± 5, p < 0.001). c Plots show mean ± SEM AMPAR EPSC amplitude of control (black) and transfected (green) CRISPR_CaMKIIα pyramidal neurons normalized to mean AMPAR EPSC amplitude before LTP induction (arrow) (Control, n = 6; CRISPR_CaMKIIα, n = 7, p = 0.029 at 35 min). d Scatterplot and bar graph of ratios normalized to control of the AMPAR EPSCs for single pairs (open circles) of control and transfected CRISPR_CaMKIIβ cells. Filled circle represents mean amplitude ± SEM (Control = 140.4 ± 21.4; CRISPR_CaMKIIβ = 143.5 ± 21.7, n = 8 pairs, p = 0.84). Bar graph of ratios normalized to control (%) summarizing the mean ± SEM of AMPAR EPSCs (102 ± 15, p = 0.87). e Plots show mean ± SEM AMPAR EPSC amplitude of control (black) and transfected (green) CRISPR_CaMKIIβ pyramidal neurons normalized to the mean AMPAR EPSC amplitude before LTP induction (arrow) (Control, n = 7; CRISPR_CaMKIIβ, n = 7, p = 0.011 at 35 min). f Scatterplot and bar graph of ratios normalized to control of the AMPAR EPSCs for single pairs (open circles) of control and transfected CRISPR_DKO cells. Filled circle represents mean amplitude ± SEM (Control = 81.9 ± 9.4; DKO = 39.1 ± 6.43, n = 11 pairs, p = 0.001). Bar graph of ratios normalized to control (%) summarizing the mean ± SEM of AMPAR EPSCs (102 ± 15, p < 0.001). g Plots show mean ± SEM AMPAR EPSC amplitude of control (black) and transfected (red) CRISPR_DKO pyramidal neurons normalized to the mean AMPAR EPSC amplitude before LTP induction (arrow) (Control, n = 13; CRISPR_DKO, n = 8, p = 0.0084 at 35 min). Gray plots represent mean ± SEM AMPAR EPSC amplitude of LTP induction in APV 50 μM. Sample AMPAR EPSC current traces from control (black) and electroporated neurons (green or red) before and after LTP are shown to the right of each graph. Raw amplitude data from dual cell recordings were analyzed using Wilcoxon signed rank test (p values indicated above). Normalized data were analyzed using a one-way ANOVA followed by a Mann−Whitney test to calculate p values (**p < 0.001). Mann−Whitney test was used also to compare LTP at 35 min (p values indicated above). Scale bars: 50 ms, 50 pA. See also Supplementary Fig. 3

