Fig. 7.
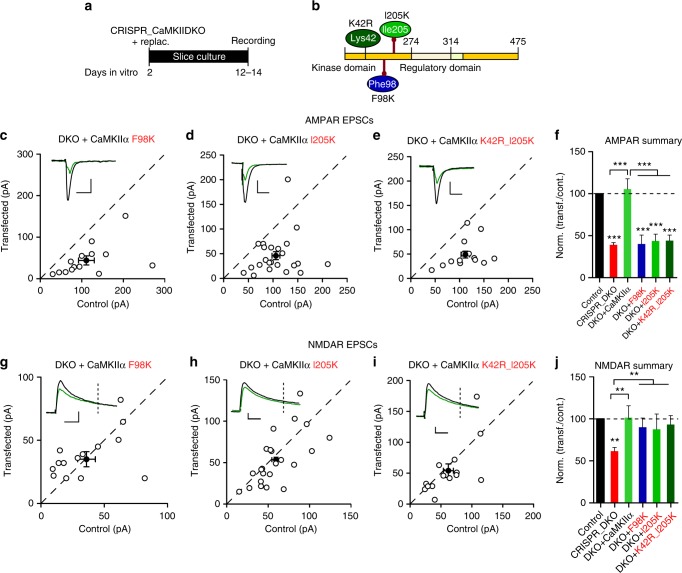
CaMKIIα binding to GluN2B is critical for basal AMPAR transmission. a Timeline of the experiment. b Scheme of the structural organization of CaMKIIα with the point mutations indicated (K42R dark green; F98K blue; I205K light green). c−e Scatterplots showing amplitudes of AMPAR EPSCs for single pairs (open circles) of control and transfected cells of DKO + CaMKIIα F98K (c, n = 14 pairs), DKO + CaMKIIα I205K (d, n = 23 pairs), and DKO + CaMKIIα K42R_I205K (d, n = 14 pairs). Filled circles indicate mean ± SEM (c, Control = 111 ± 19.9; DKO + CaMKIIα F98K = 44.33 ± 11.8, p = 0.002; d, Control = 106.8 ± 8.1; DKO + CaMKIIα I205K = 46.5 ± 8.6, p < 0.0001; e, Control = 112.5 ± 9; DKO + CaMKIIα I205K_K42R = 49.5 ± 7.5, p < 0.0001). f Bar graph of ratios normalized to control (%) summarizing the mean ± SEM of AMPAR EPSCs of values represented in c (40 ± 1.1, p < 0.0001), d (45.5 ± 7.2, p < 0.0001) and e (44.6 ± 5.6, p < 0.0001). DKO data (red bar) from Fig. 1l and DKO + CaMKIIα (light green) from Fig. 3e values are included in the graph. g–i Scatterplots showing amplitudes of NMDAR EPSCs for single pairs (open circles) of control and transfected cells of DKO + CaMKIIα F98K (g, n = 14 pairs), DKO + CaMKIIα I205K (h, n = 23 pairs), and DKO + K42R_I205K (i, n = 14 pairs). Filled circles indicate mean ± SEM (g, Control = 36.2 ± 7.7; DKO + CaMKIIα F98K = 35.3 ± 6, p = 0.49; h, Control = 59.3 ± 5.4; DKO + CaMKIIα I205K = 53.2 ± 6.4, p = 0.20; i, Control = 62.8 ± 8.5; DKO + CaMKIIα I205K_K42R = 54.9 ± 11.4, p = 0.18) j Bar graph of ratios normalized to control (%) summarizing the mean ± SEM of NMDAR EPSCs of values represented in g (101 ± 14, p = 0.62), h (91.1 ± 7.3, p = 0.74) and i (88.2 ± 10.2, p = 0.66). DKO data (red bar) from Fig. 1p and DKO + CaMKIIα (light green bar) from Fig. 3h values are included in the graph. Raw amplitude data from dual cell recordings were analyzed using Wilcoxon signed rank test (p values indicated above). Normalized data were analyzed using a one-way ANOVA followed by the Mann−Whitney test (***p < 0.0001; **p < 0.001). Scale bars: 50 ms, 50 pA

