Fig. 3.
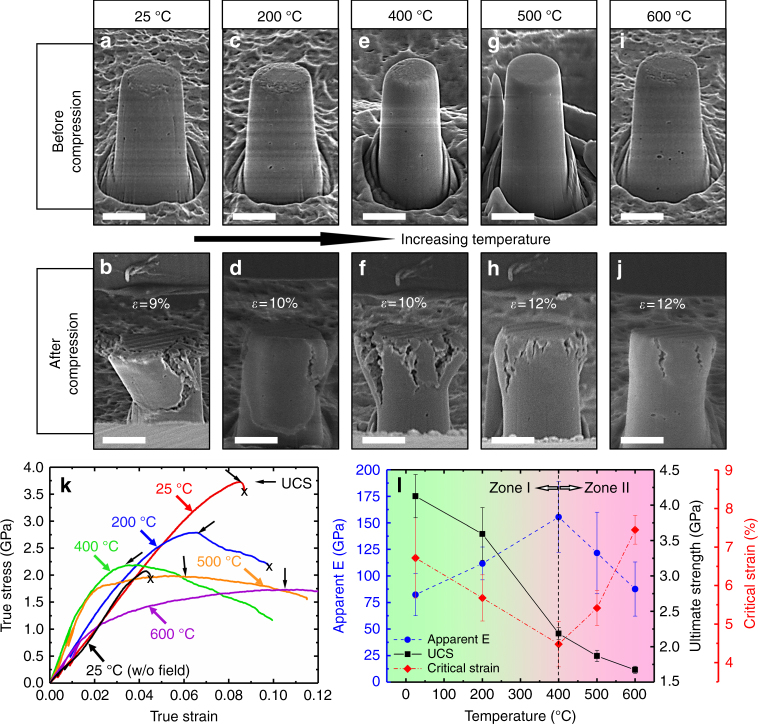
SEM images of the flash-sintered 3YSZ micropillars before and after compression tests from 25 to 600 °C and corresponding mechanical properties. a–d When tested at 200 °C and below, the pillar fractured in a brittle manner (into two major sections) at very large true strain. Scale bar, 2 μm. e–j When tested at 400–600 °C, multiple cracks formed and propagated slowly into the pillars, leading to formation of the cauliflower type of pillar tops. At 600 °C, crack density and propagation distance were substantially reduced. Scale bar, 2 μm. k Corresponding true stress–strain curves of pillars tested at different temperatures. Black arrows indicate the ultimate compressive strength (UCS) of the pillars. Partial unloadings at 0.5 and 1% strains were performed to investigate the apparent elastic moduli of pillars tested at different temperatures. A stress–strain curve for 3YSZ sintered without the electrical field is shown as reference. l Ultimate compressive strength (UCS) decreases monotonically with increasing test temperature. The elastic modulus increases with test temperature up to 400 °C and decreases thereafter. Meanwhile, the critical strain at which the first crack nucleates decreases with temperature to a minimum of 4.5% at 400 °C and increases thereafter to 7.5% when tested at 600 °C. 400 °C is the onset temperature where a different inelastic deformation mechanism begins to operate. Zone 1 represents phase transformation toughening from room temperature to 400 °C. Zone 2 corresponds to dislocation creep dominant plasticity above 400 °C

