Figure 5.
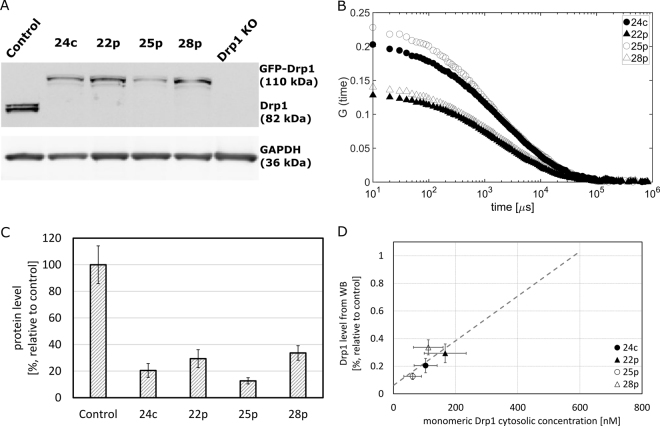
Drp1 concentration in the cell as determined by FCS and WB. (A) WB analysis of the levels of Drp1 protein in HeLa wt (Control) and in the gene-edited GFP-Drp1 stable HeLa cell lines as well as in HeLa Drp1 KO. All gene-edited stable cell lines (24c, 22p, 25p, 28p) lack endogenous non-labeled Drp1. Full membrane scans are shown on the Supplementary Fig. S8. (B) The autocorrelation curves, G, measured in four different GFP-Drp1 stable cell lines. The values of G at short times (~10 μs) are inversely proportional to concentration and indicating the differences in Drp1 expression levels in the studied cell lines. (C) Quantitative analysis of the WB shows differences in the Drp1 expression levels in the HeLa wt and GFP-Drp1 stable HeLa cell lines. (D) From the correlation (gray dashed line) of the results obtained by WB and FCS, the concentration of Drp1 in the HeLa wt line can be estimated. FCS results were used to calibrate the WB results. Error bars represent standard deviation.

