Figure 6.
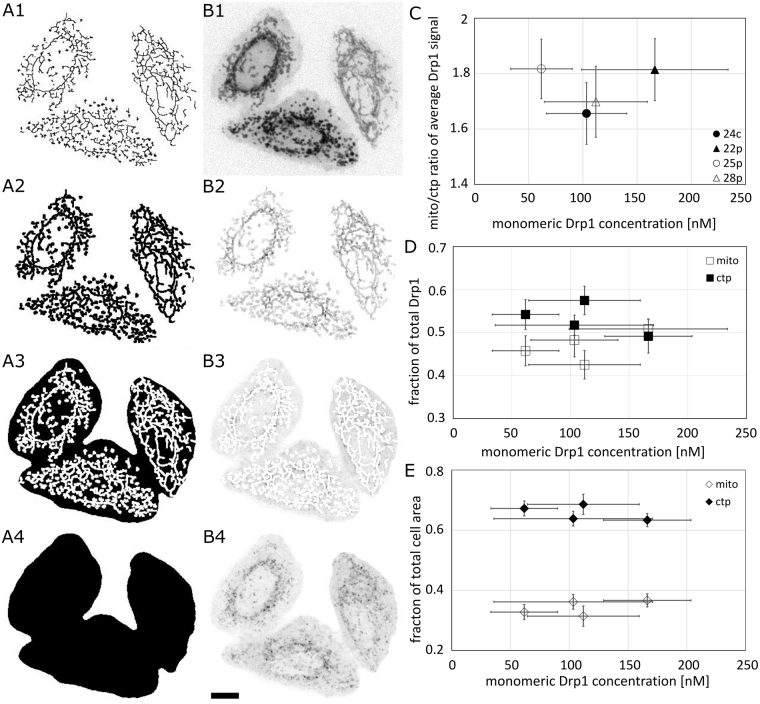
Cytoplasmic and mitochondrial fractions of Drp1 in the cell. The GFP-Drp1 fluorescence signal was measured in different parts of the cell based on the binary masks created for the mitochondria (A2), cytoplasm (A3) and whole cell (A4) based on mito-mNeptune staining (B1). The cytoplasm mask (A3) was created by subtracting the mitochondrial mask from the whole cell mask. The GFP-Drp1 signals corresponding to the mitochondria, cytoplasm and whole cell are shown in B2, B3 and B4, respectively. A1 corresponds to the mitochondrial network detected using the Ridge detection plugin (ImageJ), which was extended by dilation to obtain the mitochondria mask (A2). Scale bar, 10 μm. (C) Graph showing correlation between the ratio of mitochondrial to cytoplasmic Drp1 signal in stable HeLa cell lines and monomeric Drp1 concentration. The fraction of total Drp1 (D) and fraction of total cell area (E) are also shown as functions of the monomeric Drp1 concentration. No clear concentration dependence has been observed for the parameters presented in the figure. Error bars represent standard deviation.

