Figure 7.
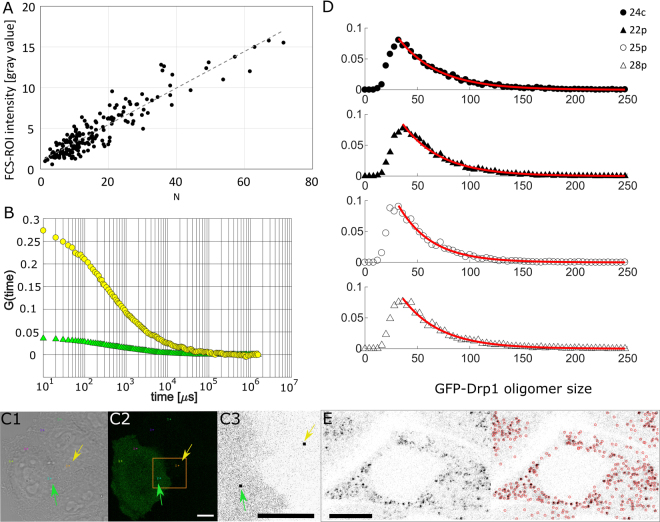
FCS-calibrated imaging. (A) Graph presenting correlation between the intensity of the FCS-ROI spot in the confocal image and the FCS-derived number of molecules in the confocal volume (N) in HeLa cells (HeLa Drp1 KO and HeLa wt) transfected with GFP and GFP-Drp1 K668E (black dots). Those parameters were observed to be linearly dependent (gray dashed line), and the linear equation was used to translate the intensities of the Drp1 spots into numbers of Drp1 monomers. (B) The different GFP-Drp1 K668E expression levels in HeLa cells enabled the calibration obtained in (A). The graph compares the autocorrelation curves obtained in cells with relatively low GFP-Drp1 K668E expression level (yellow circles) and in cells with relatively high GFP-Drp1 K668E expression level (green triangles). The regions corresponding to these FCS curves are marked with a yellow arrow (region of autocorrelation curve presented as yellow circles) and a green arrow (region of autocorrelation curve presented as green triangles) in cells shown in transmitted light (C1) and in the GFP fluorescence channel (C2). (C3) Enlarged region presented in yellow box in C2. The black squares indicated by arrows represent spots whose areas were 8 × 8 pixels, and the mean intensity (gray value) of these areas was used for the calibration presented in (A). (D) Normalized histograms presenting size distributions of Drp1 spots in stable HeLa cell lines. Sizes of GFP-Drp1 oligomers are presented as the number of Drp1 monomers in detected spots. Red lines represent histograms fitted according to the model of isodesmic supramolecular polymerization, giving the value of the equilibrium constant Kd. (E) Detection of Drp1 spots in TrackMate plugin (ImageJ). The picture taken for analysis is shown on the left, and the red circles on the right represent Drp1 spots detected at a certain threshold. GFP-Drp1 expression is shown in black. Scale bar, 10 μm.

