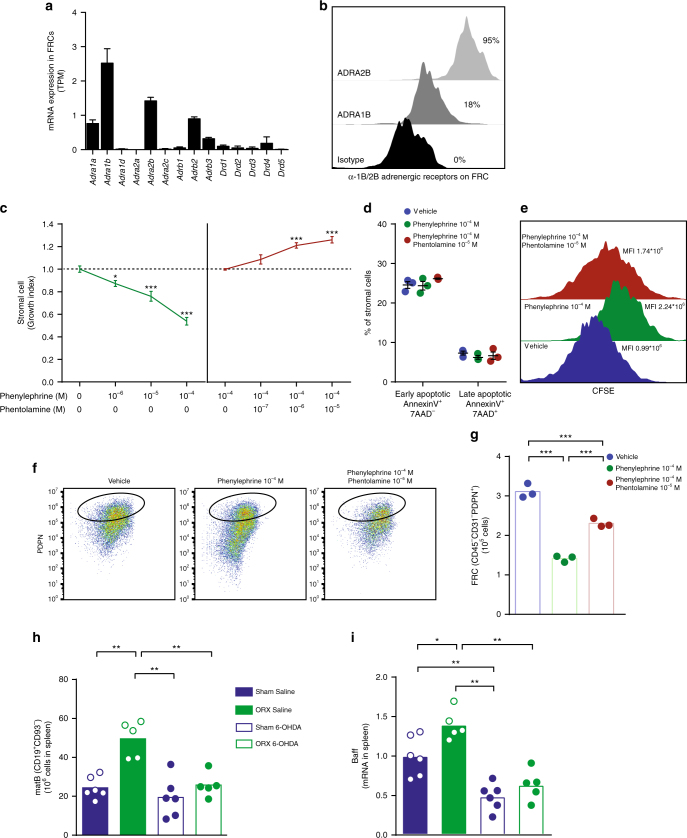
Fig. 6.
α-Adrenergic manipulation regulates FRC numbers. a Transcripts per million (TPM) of all α- and β-adrenergic receptor and dopamine receptor family members in splenic fibroblastic reticular cells (FRC). Each splenic FRC sample (n = 2) was generated by pooling lysed sorted cells from three independent sorts in which spleens from 5 to 10 male mice were combined. b α-Adrenergic receptor protein staining in FRCs analysed by flow cytometry. Percentages indicate proportion of FRCs staining positively for ADRA2B and ADRA1B, respectively. Data are from one experiment representative of two independent experiments. c Primary splenic stromal cell number after exposure to the α-adrenergic agonist phenylephrine (10−6–10−4 M) and/or the α-adrenergic antagonist phentolamine (10−7–10−5 M) for 48 h. Data were pooled from three and two separate experiments, respectively. d–g Proportion of annexin V+ cells (d), carboxyfluorescein succinimidyl ester (CFSE) content in the cells (e), and number of FRCs (f, g) after exposure to phenylephrine (10−4 M) with or without phentolamine (10−5 M) for 48 h. Data are from one experiment. h Mature B cells (matB) (CD19+CD93–) in spleens of castrated (ORX) or sham-operated male mice treated with saline or 6-hydroxydopamine (6-OHDA) (Sham Saline, n = 6; ORX Saline, n = 5; Sham 6-OHDA, n = 6; ORX 6-OHDA, n = 5). i Baff mRNA levels in the spleen of castrated (ORX) or sham-operated male mice treated with saline or 6-OHDA (Sham Saline, n = 6; ORX Saline, n = 5; Sham 6-OHDA, n = 6; ORX 6-OHDA, n = 5). All bars indicate means; circles represent individual mice; error bars indicate s.e.m. *P < 0.05, **P < 0.01 and ***P < 0.001. P-value from one-way ANOVA followed by Bonferroni correction in c and g and Kruskal–Wallis test followed by Mann–Whitney test in h–i

