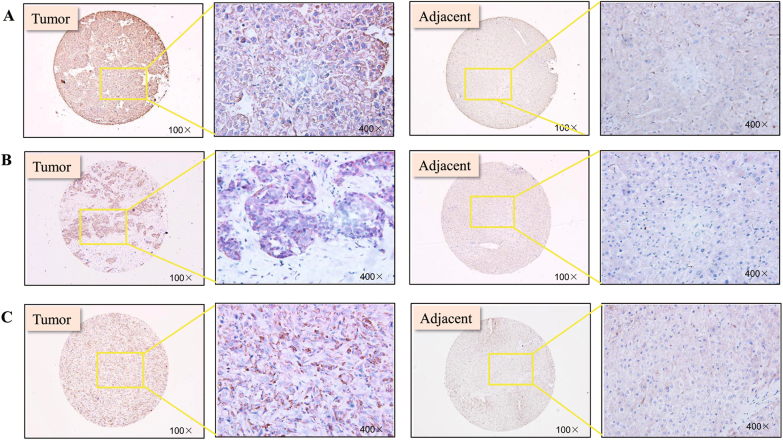
Fig. 1. ANXA5, RAC1, and CRKL expression profiles and correlationships in tumors tissues of HCC patients.
a ANXA5, b CRKI/II, and c RAC1 were overexpressed in tumors tissues from 46 HCC patients (Table 1). ANXA5 (P = 0.015) and RAC1 (P = 0.015) overexpression was related to the TNM stage (Table 2). CRKI/II was positively correlated with the gender of HCC patients (P = 0.029). The positive correlations of the expression levels of ANXA5 with CRKI/II (P = 0.009, R = 0.512) and RAC1 (P = 0.0003, R = 0.761), and RAC1 with CRKI/II (P = 0.001, R = 0.465) (Table 3)

