Figure 2.
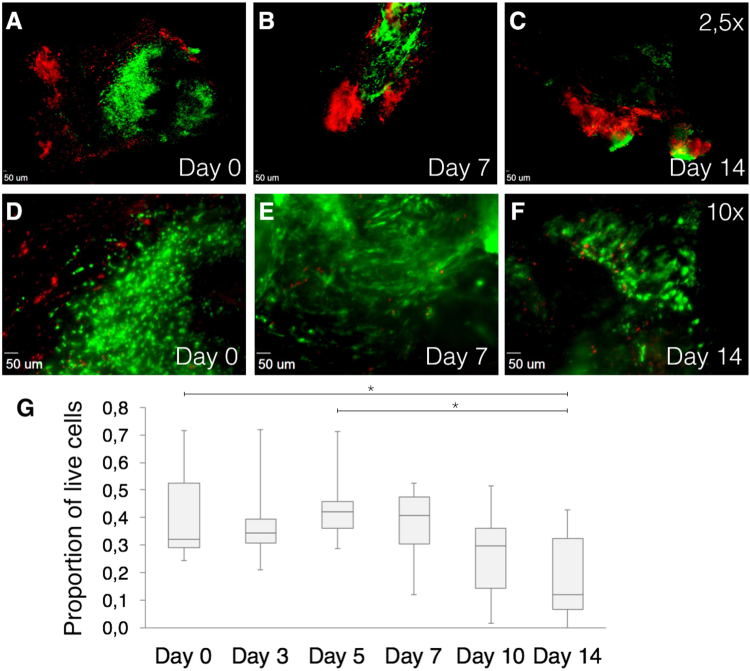
Immunofluorescence images using Zeiss Axiovert 200 M Marianas™ Microscope. Cells stained with LIVE/DEAD® Viability/Cytotoxicity Kit. (A–B) 2.5× magnification of cultured tissues at day 0, 7 and 14, respectively. (D–F) 10× magnification of cultured tissues at day 0, 7 and 14, respectively. Green fluorescence shows live cells, while red fluorescence indicates dead nuclei. Live cells are mainly located central to tissue. (G) Quantification of live human cells in harvested vascular tissues of distinct patients (N = 9). Box plots show proportions of square micron of green fluorescence divided by the sum of green and red fluorescence. *P < 0.05 compared with other time points using ANOVA with Bonferroni test.

