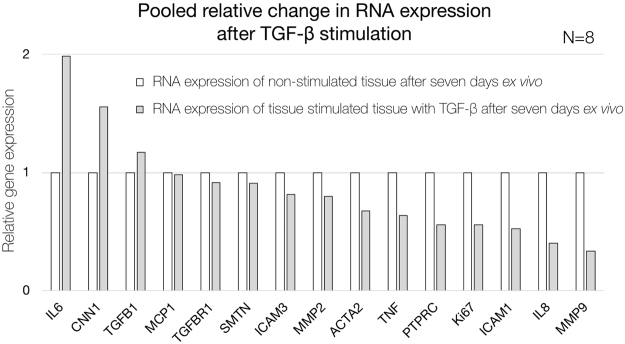
Figure 8.
Quantification of gene expression of pooled non-stimulated (white) and TGF-β-stimulated (grey) AAA patient tissue sections after seven days ex vivo. Relative expression is shown as ratio based on non-stimulated tissue sections. IL6 indicates interleukin 6; CNN1, calponin 1; TGFB1, transforming growth factor beta 1; MCP1, monocyte chemotactic protein 1; TFBR1, transforming growth factor beta receptor 1; SMTN, smoothelin; ICAM3, intercellular adhesion molecule 3; MMP2, matrix metalloproteinase-2; ACTA2, alpha smooth muscle actin 2; TNF, tumor necrosis factor; PTPRC, protein tyrosine phosphatase, receptor type, C; Ki67, antigen KI-67; ICAM1, intercellular adhesion molecule 1; IL8 (or CXCL8), interleukin 8 and MMP9, matrix metalloproteinase-9.

