Figure 1.
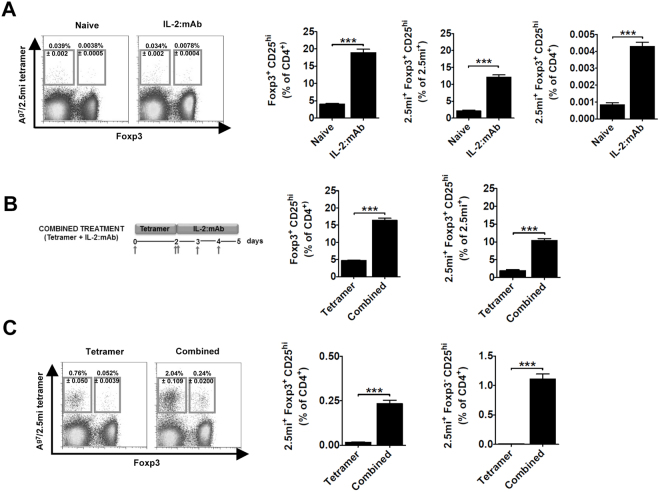
The administration of a combined treatment of Ag7/2.5 mi tetramers and IL-2:mAb complexes increases the percentage of antigen-specific regulatory T cells in NOD.Foxp3EGFP mice. Analysis of the spleen are shown. Ten to twelve weeks-old NOD.Foxp3EGFP mice were injected i.p. with 3 daily doses (days 0, 1, 2) of IL-2:anti-IL-2 mAb JES6–1A12 (IL-2:mAb; complex ratio 1:5 µg) or left untreated (n = 9 per experimental group). Spleens were removed at day 3 and analyzed by flow cytometry. (A, left) Representative flow cytometric profiles showing 2.5 mi+Foxp3+ (Treg) and 2.5 mi+Foxp3− (Tconv) T cell percentages ± SEM within total CD4+ T cells. (A), center panels) Expansion of polyclonal and 2.5 mi+ CD25highFoxp3+CD4+ T cell populations within total CD4+ (left) or antigen-specific CD4+ T cells (right). (A, right) Bar graph indicating the percentage of 2.5 mi+Foxp3+CD25high T cells found in spleen after each treatment. (B) Schematic diagram of the combined treatment based on the administration of Ag7/2.5 mi tetramers and IL-2:mAb complexes (left). Arrows indicate days of protein injection. 25 µg of tetramer and 1:5 µg of IL-2:mAb complexes are injected i.p. per mouse and dose. Ten to 12 weeks-old NOD.Foxp3EGFP mice were treated as shown or with Ag7/2.5 mi tetramer only (n = 9–12 animals per group). Spleens were harvested on day 5 and cells analyzed by flow cytometry. Analysis of total Foxp3+CD25hi cells within total CD4 T cells (B, middle) and of 2.5 mi+Foxp3+CD25hi CD4 T cells within 2.5 mi+ T cells (B, right) is shown. (C) Left panel, representative dot plot data showing splenic 2.5 mi+Foxp3+ (Treg) and 2.5 mi+Foxp3− (Tconv) T cell percentages ± SEM after combined or tetramer only treatment. Middle and right panel, analysis of 2.5 mi+ CD25hiCD4+Foxp3+ and 2.5 mi+ CD25hiCD4+Foxp3− T cells within total CD4+ T cells is shown. For the analysis, cells were gated on CD19−, CD8−, CD11c−, F4/80−, propidium iodide (PI)−, CD4+ and CD25hi. Errors bars indicate mean ± SEM. The p values were determined by Student t test. ***p < 0.0005. Graphs represent a compilation of 3–4 independent experiments. No Ag7/GPI-specific T cell expansion was observed in naive or treated mice analyzed in this figure.

