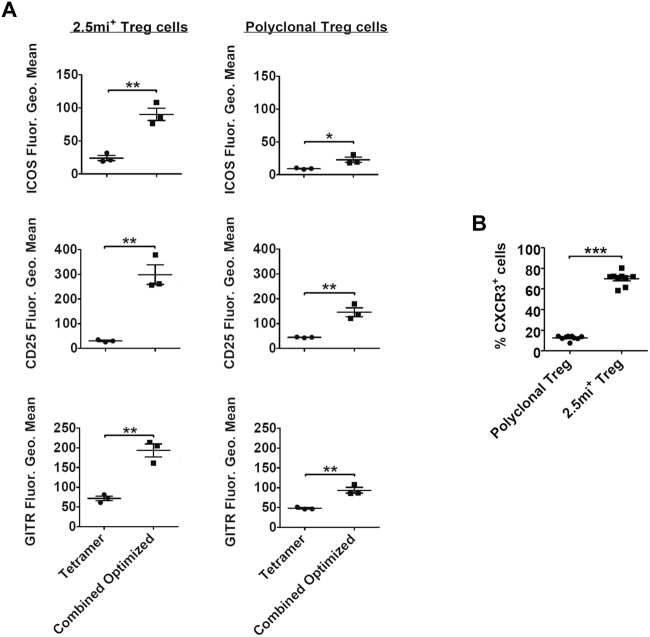
Figure 5.
Phenotype surface markers on regulatory T cells expanded with the combined optimized treatment. Analysis of the spleen is shown. NOD.Foxp3EGFP females received either the combined optimized treatment or Ag7/2.5 mi tetramer injections only. Spleens were isolated at day 8 of treatment and used for the determination of: (A) the MFI of ICOS, CD25 and GITR, on the surface of 2.5 mi+ (left) and polyclonal (right) Foxp3+CD4+ T cells from treated animals; (B) the percentages of CXCR3+ cells within antigen-specific (right) or polyclonal (left) Foxp3+CD4+ T populations. 2.5 mi+ cells were excluded from polyclonal T cells for all the analysis. Data shown in (A) is a representative example from 3 independent experiments; n = 2-3 animals/experimental group. Data in (B) is a compilation of 3 independent experiments with 2-3 animals per treatment group. No Ag7/GPI-specific T cell expansion was observed in any experiment.

