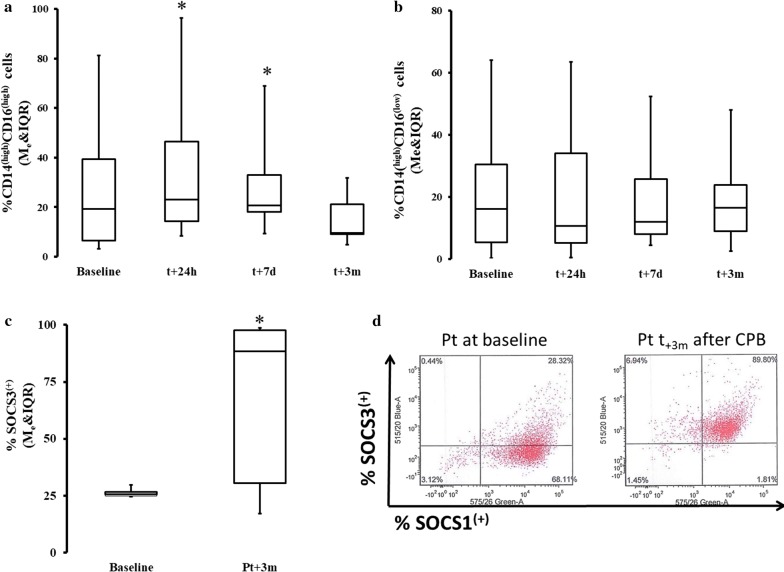
Fig. 1.
Change in the phenotype and kinase makeup of the post-CPB. Fresh MO were stained with flow cytometry antibodies. There was a significant difference in post hoc analysis baseline in frequency %CD14(high)CD16(high) MO (Me = 13.54; IQR[6.15, 24.39] ) vs t + 24 h and vs t + 7d, t24h: Me = 22.63; IQR[13.32, 45.06] ΔRank = − 15.00; CI95% = [− 27.81, − 2.19]; p = 0.034; CLES = 0.86; t7d: Me = 20.58; IQR[18.11, 33.09]; ΔRank = − 15.00; CI95% = [− 27.81, − 2.19]; p = 0.034; CLES = 0.71 (a). There was no significant difference in %CD14(high)CD16(low) (b). A significant increase in predominantly M2-promoting kinases were seen in peripheral blood MO population at 3 months. The population SOCS3(high) cells was significantly increase at t3m: Me = 88.46; IQR[30.56, 97.60] as compared to pre-CPB level: Me = 24.77; IQR[24.17, 25.83] ΔpMe = − 39,41; CI95%: ΔpMe[− 72.47, − 3.16]; p = 0.047; CLES = 0.78 (c). This shift is very clear if data from the same patient are shown (d). Asterisk indicate data points which were significantly different when compared vs baseline. CI95%: 95% confidence interval for difference in sum of ranks. CLES common language effect size

