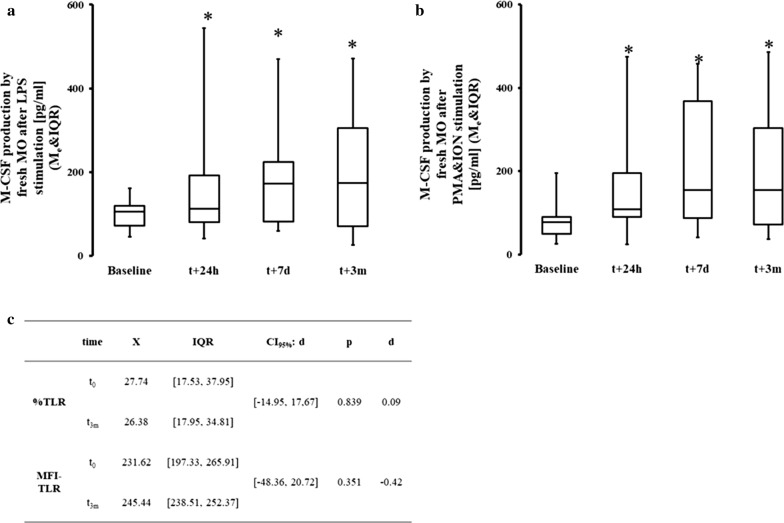
Fig. 3.
Changes in post-CPB M-CSF production. Production of M-CSF in response to LPS (a) and PMA and ION (b) was assessed in vitro together with flow cytometric expression of M-CSFR and TLR on circulating MO (c). a There was a significant difference in all data points in M-CSF production with LPS stimulation t0: Me = 121.00; IQR[48.50, 189.00] t24h: Me = 4567.00; IQR[1298.50, 5755.00]; ΔRank = − 31.00; CI95% = [− 44.28, − 17.72]; p = 0.003; CLES = 0.89; t7d: Me = 2053.00; IQR[375.50, 7036.50]; ΔRank = − 30.00; CI95% = [− 43.28, − 16.72]; p < 0.001; CLES = 0.89; t3m: Me = 1346.00; IQR[192.00,5627.00] ΔRank = − 21.00; CI95% = [− 34.28, − 7.72]; p = 0.003; CLES = 0.79. b Production of M-CSF after PMA and ION stimulation was increased at all data point when compared with baseline t0: Me = 93.00; IQR[38.00, 192.50]; t24h: Me = 3321.00; IQR[530.00, 6532.00]; ΔRank = − 22.00; CI95% = [− 34.73, − 9.27]; p = 0.002; CLES = 0.94; t7d: Me = 2341.00; IQR[265.00, 8356.50]; ΔRank = − 21.00; CI95% = [− 33.73, − 8.27]; p = 0.002; CLES = 0.69; t3m: Me = 341.00; IQR[106.00, 4249.00]; ΔRank = − 23.00; CI95% = [− 35.73, − 10.27]; p = 0.002; CLES = 0.88. c Receptor expression of TLR4 was unchanged in terms of both positive cells and receptor density (MFI). Asterisk indicate data points which were significantly different when compared vs baseline. CI95%: 95% confidence interval for difference in sum of ranks. CI95%: ΔpMe-95% confidence interval for difference in pseudomedians. CLES common language effect size

