Fig. 2.

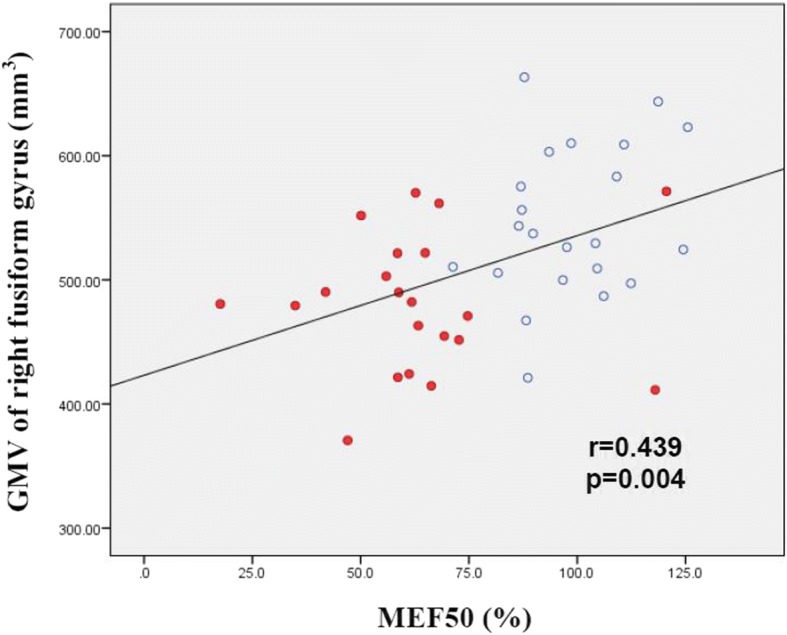
Scatter plot of GMV versus MEF50 for patients in APF group (red dots) and NPF group (open circles). Smaller GMV in the right fusiform gyrus was associated with lower pulmonary functional parameters (i.e., MEF50 [r = 0.439, p = 0.004])

Scatter plot of GMV versus MEF50 for patients in APF group (red dots) and NPF group (open circles). Smaller GMV in the right fusiform gyrus was associated with lower pulmonary functional parameters (i.e., MEF50 [r = 0.439, p = 0.004])