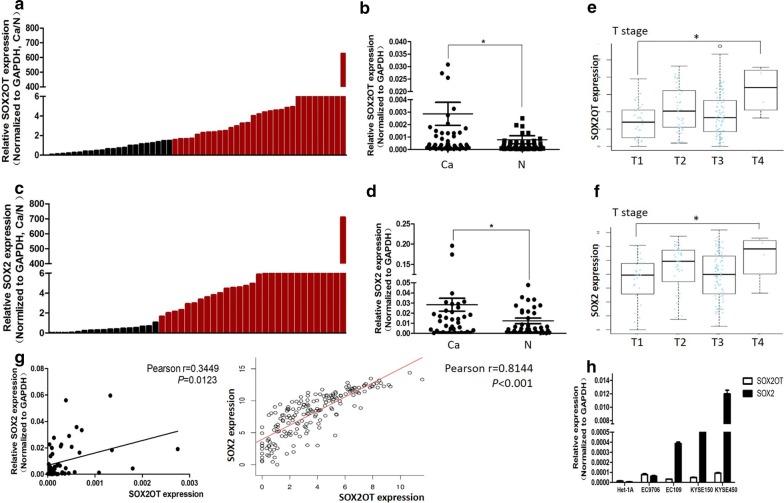
Fig. 1.
The RNA expression of SOX2OT and SOX2 in ESCC tissues and cell lines. a, b qPCR analysis of SOX2OT expression in 54 pairs ESCC and adjacent normal tissues. Over-expression of SOX2OT was detected in 57.4% (31/54) of ESCC tissues. c, d qPCR analysis of SOX2 mRNA expression in 46 pairs ESCC and adjacent normal tissues. Overexpression of SOX2 was detected in 63.0% (29/46) of ESCC tissues. The red column was defined as overexpression (fold change > 1.5). e, f Online analysis of SOX2OT and SOX2 expressions in 184 patients. Both SOX2OT and SOX2 expressions were positively associated with T stage of esophageal cancers. The statistical differences between the two groups were analyzed by unpaired Student’s t test. *P < 0.05. g Pearson correlation analysis was used to examine the association between SOX2OT and SOX2 with local and online data, respectively. SOX2OT expression was positively associated with SOX2 mRNA expression in ESCC tissues. h qPCR analysis of SOX2OT and SOX2 expression in ESCC cells and the normal epithelial cell line Het-1A. The expression of SOX2OT and SOX2 was higher in ESCC cells

