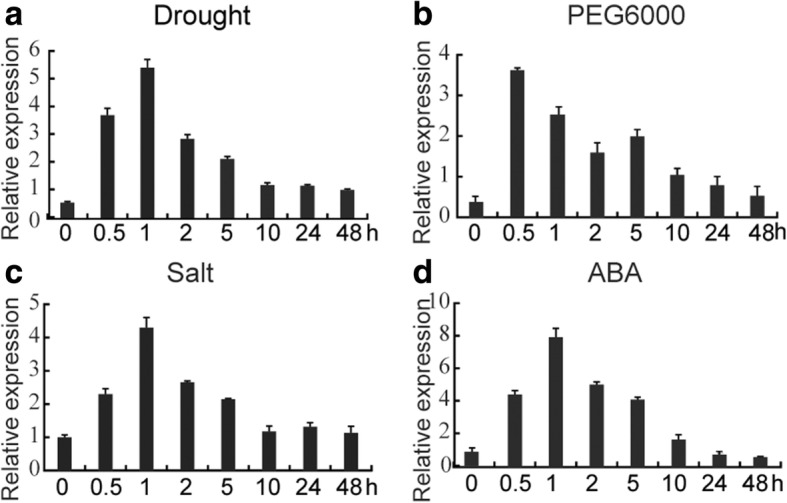
Fig. 1.

Expression patterns of TaCIPK23 under various abiotic stresses and subcellular localization of TaCIPK23 in wheat protoplasts. Expression profiles of TaCIPK23 after treatment with a Drought, b PEG6000, c NaCl, and d ABA for 0, 0.5, 1, 2, 5, 10, 24, and 48 h. Transcript levels were quantified by qRT-PCR assays. Expression of Actin was analyzed as a loading control. Ten wheat seedlings were combine as a single sample. Each data point is the mean (±SE) of three experiments
