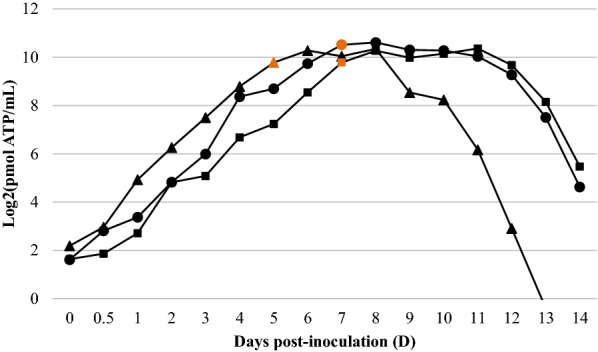
Figure 1.

ATP growth curves of M. hyopneumoniae strains J (filled triangle), 11 (filled square) and 232 (filled circle). Data points represent means of the 2 replicate ATP luminometry measurements (A and B) within each strain. The orange data points indicate when the original medium colour change was first visually detected in each strain culture.
