Fig. 1.
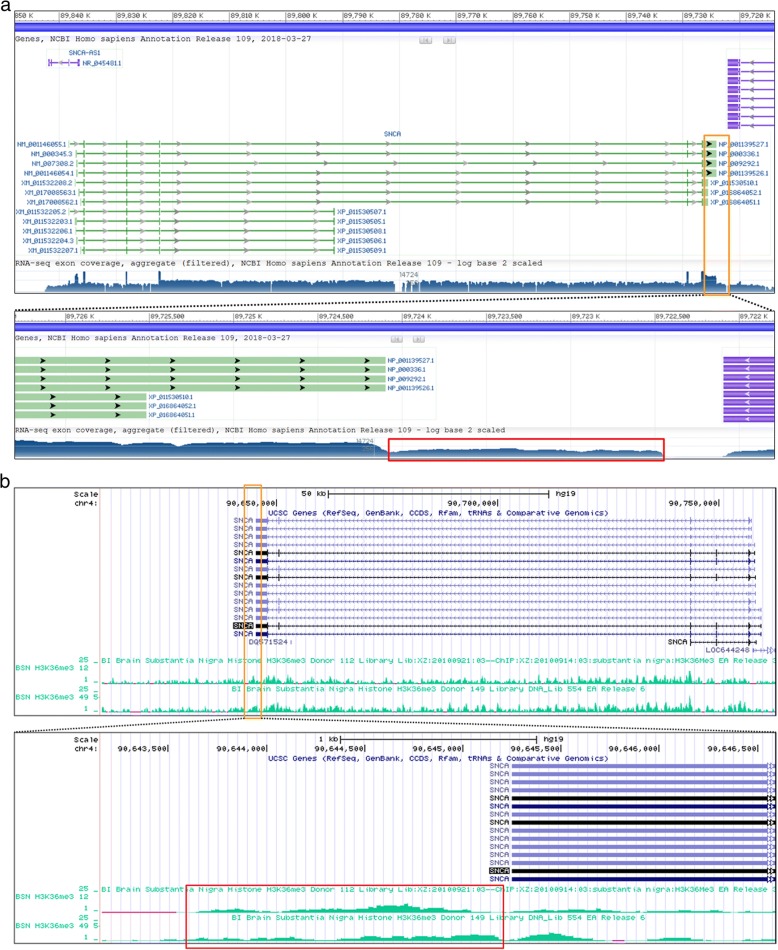
RNA-seq data of α-SYN transcripts and H3K36me3 histone distribution of the SNCA gene. a RNA-seq coverage data of SNCA in NCBI Homo sapiens Annotation (GRCh38.p12 assembly) is shown. Data near the last exon of SNCA (Orange box) is shown in the lower panel. Red rectangular box indicates the predicted extension of α-SYN 3′UTR. b The H3K36me3 distribution data of SNCA from two adult postmortem SN tissues collected by the NIH Roadmap Epigenomics Mapping Consortium [28, 29] is shown. The UCSC genome browser image (GRCh37/hg19 assembly) was obtained according to the instruction of the data table page. Data near the last exon of SNCA (Orange box) is shown in the lower panel. Red rectangular box indicates continuous H3K36me3 coverage after the annotated exon of SNCA. Note that transcriptional direction is from right to left

