Fig. 13.

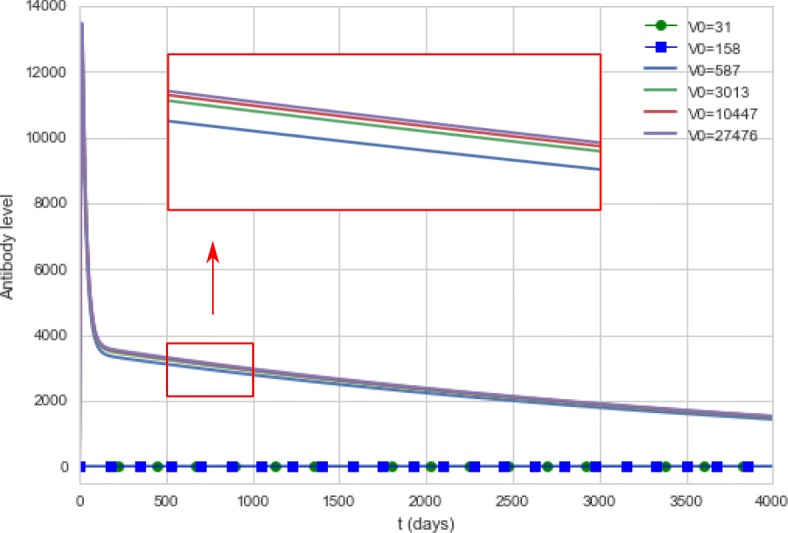
Antibody curves generated by the computational model. The model simulates the antibody concentrations during a 4,000-day period for different doses of the vaccine. For doses equal to 31 IU and 158 IU, the antibody curves were equal to zero

Antibody curves generated by the computational model. The model simulates the antibody concentrations during a 4,000-day period for different doses of the vaccine. For doses equal to 31 IU and 158 IU, the antibody curves were equal to zero